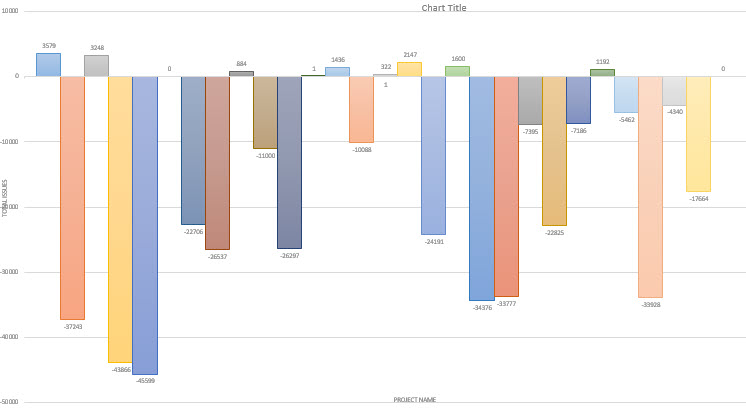
I have list of projects which has been scanned by Sonar. My manager want to know how many issues has been fixed in each project in a graphic. Example picture:
I can view project which has fixed number of issues and project which has not fixed their issues but add more issues instead in this picture. Is there a way to get this kind of chart for report?
Notes: These charts including removed resolution which it should not
As you’ve probably figured out, this graph is not available in SonarQube. What’s available instead is a series of bubble charts showing Risk, Reliability, &etc
More generally, what we make very visible is the QG status, because that’s what we really feel you should be paying attention to
And if the concern is really which projects are adding issues, this is the way to go: set up a default Quality Gate that’s focused on New Code. In fact, the Built-in Sonar way Quality Profile focuses exclusively on New Code
And if you have a Quality Gate that focuses on new code, then you don’t really need fancy graphs to know which projects are doing well, you just look at which ones are releasable (passing the Quality Gate) and which ones aren’t.
Hi thank you for your reply, I really appreciate that. I want to explain what my manager needs more clear (since I think I didn’t explain it well)
Actually what my manager what to know is :
how many issues can be fixed by each projects within particular time, for example one month
from fixed issues, how many bugs, vulnerability and code smells has been fixed.
At first I view activity to view is it going up or down and calculate the value manually to decide how many bugs has been fixed. then I realised there is removed and fixed type, so this solution is not precise. So I can not answer the first question yet.
Next, I have to manually view Issues tab on each project with Resolution Fixed to answer the second question of my manager. And we have quite a lot big projects and small projects, so it is quite taking a lot of time.
What about fixed? If I fix it directly on my code, statuse will be “Fixed”.
But, is there other criteria to make issues “Fixed”?
Because I got a project with more than 3000 fixed issues and my manager ask me if there are any criteria from Sonar to make issues “Fixed”
I have tried to create report but It seems I got a new problem about the value.
I want to know total fixed issues each month and week in each projects.
Right now, I am looking total fixed from creation date, but I realized it is not working since it shows creation date not fixed date.
I create bugs on October, then I fixed it on November, to know wether it has been fixed or not and when I should look at October month and check the history.
There’s no search parameter for closed or even updated date. Also, closed issues are purged on a regular basis. You’re really not going to be able to report on close volume accurately.
I think I found a solution, but I am not quite sure since I don’t know how accurate it is. I will use API from Sonar: GET api/issues/search
with parameter :
componentKeys = projectKey ,
resolutions = FIXED,
types = BUGS,CODE_SMELL, VULNERABILITY,
s = CLOSE_DATE
This API will shows total fixed issues and I will group by the issues based on close_date. Therefore, I will get fixed issues based on close_date (which I assume as closed issues date,is it correct?)
Good catch! I missed that when I glanced through the docs for my earlier answer. And I’ve just double-checked the response, and closeDate is part of it. So it looks like you’ll be able to do this after all! Sorry I steered you wrong before.