I’m running SonarCloud analysis through GitHub Actions using the official sonarqube-scan-action. The scan hangs indefinitely at 12 out of 13 source files, and never completes. Here’s what I see in the logs:
03:06:46.209 INFO SCM Publisher SCM provider for this project is: git
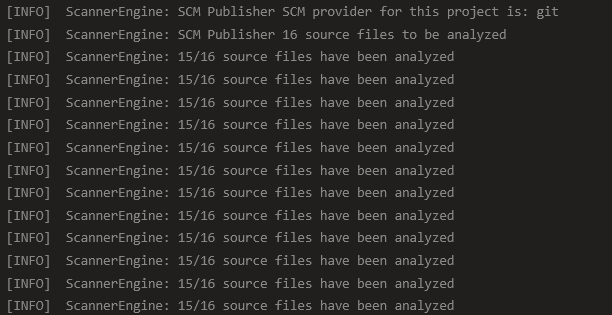
03:06:46.209 INFO SCM Publisher 13 source files to be analyzed
03:06:56.210 INFO 12/13 source files have been analyzed
03:07:06.210 INFO 12/13 source files have been analyzed
03:07:16.210 INFO 12/13 source files have been analyzed
03:07:26.211 INFO 12/13 source files have been analyzed
03:07:36.211 INFO 12/13 source files have been analyzed
03:07:46.211 INFO 12/13 source files have been analyzed
03:07:56.211 INFO 12/13 source files have been analyzed
03:08:06.211 INFO 12/13 source files have been analyzed
03:08:16.211 INFO 12/13 source files have been analyzed
03:08:26.211 INFO 12/13 source files have been analyzed
03:08:36.212 INFO 12/13 source files have been analyzed
03:08:46.212 INFO 12/13 source files have been analyzed
03:08:56.212 INFO 12/13 source files have been analyzed
03:09:06.212 INFO 12/13 source files have been analyzed
03:09:16.212 INFO 12/13 source files have been analyzed
03:09:26.212 INFO 12/13 source files have been analyzed
03:09:36.213 INFO 12/13 source files have been analyzed
03:09:46.213 INFO 12/13 source files have been analyzed
03:09:56.213 INFO 12/13 source files have been analyzed
03:10:06.213 INFO 12/13 source files have been analyzed
03:10:16.213 INFO 12/13 source files have been analyzed
03:10:26.213 INFO 12/13 source files have been analyzed
03:10:36.214 INFO 12/13 source files have been analyzed
Is there a way to:
Identify the last file causing the hang?
Enable deeper logging (e.g., the name of file 13)?
We have a similar issue with our SonarCloudAnalyze@3 task on Azure DevOps on the default agents. Some of our builds have the same error as above. Other builds will stay stuck at the following:
09:51:12.910 INFO SCM blame is in progress..
09:51:22.911 INFO SCM blame is in progress..
09:51:32.911 INFO SCM blame is in progress..
09:51:42.911 INFO SCM blame is in progress..
09:51:52.912 INFO SCM blame is in progress..
09:52:02.912 INFO SCM blame is in progress..
09:52:12.912 INFO SCM blame is in progress..
09:52:22.913 INFO SCM blame is in progress..
The issue appeared yesterday around noon (Amsterdam time).
Nothing changed on the pipeline, it used to scan the project without issue.
For the user, it is a normal/known email address.
The error message related to the user only shows in debug so I have no way to tell you whether this was present or not before yesterday (but I expect it was).
The space in the committer email was a red herring. Can someone (@Loic_Otten ? ) provide a thread dump?
To get a thread dump, connect to the machine having the issue while the process is hanging (not easy on CI, but maybe you can reproduce by running the scanner locally?), then use any of the techniques here: https://www.baeldung.com/java-thread-dump
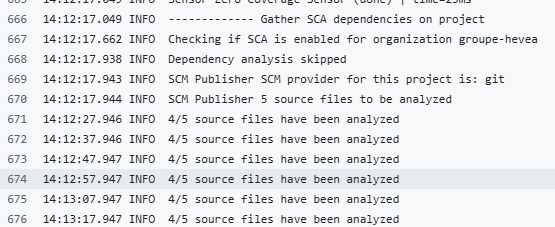
3:34:44.633 INFO  Checking if SCA is enabled for organization upnify
13:34:45.250 INFO  Dependency analysis skipped
13:34:45.257 INFO  SCM Publisher SCM provider for this project is: git
13:34:45.257 INFO  SCM Publisher 13 source files to be analyzed
13:34:55.259 INFO  12/13 source files have been analyzed
13:35:05.259 INFO  12/13 source files have been analyzed
And when sonarcloud starts to analyze the files, it stays there and the github action hangs for 2 hours.
13:54:21.065 DEBUG Found GIT version: 2.49.0
13:54:21.066 DEBUG Blame file (native) wkf/js/dictionary.js
13:54:21.070 DEBUG Blame file (native) wkf/json/tasks_modals.json
13:54:21.282 DEBUG Blame file (native) _core/js/utils.js
13:54:21.282 DEBUG Blame file (native) common/js/taskList.controller.js
13:54:21.388 DEBUG Blame file (native) wkf/js/controllers/Tasks.controller.js
13:54:21.543 DEBUG Blame file (native) wkf/js/controllers/workflowsTasks.controller.js
13:54:21.697 DEBUG Blame file (native) wkf/js/main.js
13:54:21.798 DEBUG Blame file (native) suite/js/dictionary.js
13:54:22.658 DEBUG Blame file (native) wkf/json/tasks_quickActions.json
13:54:22.710 DEBUG Blame file (native) wkf/js/controllers/kanbanTasks.controller.js
13:54:22.761 DEBUG Blame file (native) common/css/_utils.scss
13:54:22.812 DEBUG Blame file (native) wkf/json/tasks.json
13:54:22.965 DEBUG Blame file (native) wkf/css/workflow.scss
13:54:30.985 INFO  12/13 source files have been analyzed
13:54:40.986 INFO  12/13 source files have been analyzed
13:54:50.986 INFO  12/13 source files have been analyzed
13:55:00.986 INFO  12/13 source files have been analyzed
13:55:10.986 INFO  12/13 source files have been analyzed
13:55:20.986 INFO  12/13 source files have been analyzed
13:55:30.986 INFO  12/13 source files have been analyzed
13:55:40.986 INFO  12/13 source files have been analyzed
13:55:50.987 INFO  12/13 source files have been analyzed
13:56:00.987 INFO  12/13 source files have been analyzed
13:56:10.987 INFO  12/13 source files have been analyzed
13:56:20.987 INFO  12/13 source files have been analyzed
13:56:30.987 INFO  12/13 source files have been analyzed
13:56:40.987 INFO  12/13 source files have been analyzed
13:56:50.987 INFO  12/13 source files have been analyzed
13:57:00.987 INFO  12/13 source files have been analyzed
13:57:10.988 INFO  12/13 source files have been analyzed
Hello, same here ! the problem appear yesterday. We use sonar github action and tried with the new github action sonarqub but we are still facing the same issue : Run SonarSource/sonarcloud-github-action@383f7e52eae3ab0510c3cb0e7d9d150bbaeab838 and same with sonarqube-scan-action@v5.2.0 :
I Use -Dsonar.verbose=true
-Dsonar.scm.use.blame.algorithm=GIT_FILES_BLAME, and it seems that the SonarQube scan passes with those options. However, I can’t modify the build.yml because I don’t have permissions on the master branch. Normally, the GitHub Actions workflow was working fine a few days ago, but it started failing yesterday.