automatic scan failing on repo, getting The last analysis has failed. it keeps on failing after several attempts,
Hi team, please suggest the solution for this issue
Hi Santosh,
Welcome to the community, and thank you for raising this issue.
The analysis you posted appears to time out after 45 minutes, which is the maximum runtime for our automatic analyses. This can happen with particularly large or complex projects.
Have you tried running the branch analysis locally using the SonarScanner CLI? If so, how long did it take? A local analysis can often reveal the source of the time complexity, such as the configuration of file inclusions or exclusions.
Hi Matt,
I tried on scan on local machine using SonarScanner CLI and scan completed without any issues and i can see the report, same is not working from automatic analysis on sonarcloud or github actions scaning in failing with error, happy to share more details if required
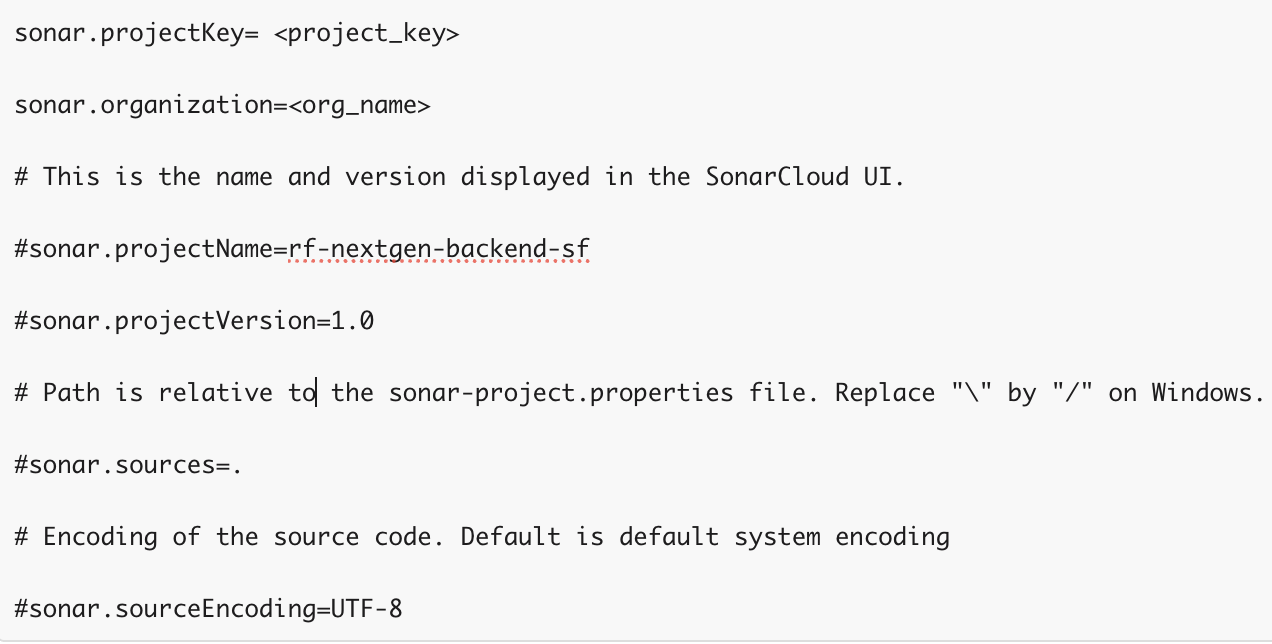
properties file used:
sonar-project.properties
Have you retried analysis that since you raised the initial issue?
In the meantime we balanced a Memory a bit on Automatic Analysis, but I am not sure whether extra memory will speed up the process enough to allow automatic analysis completion within the allowed 45 minutes max run duration.we allow for it.
Out of curiosity, how much time did the branch scan take on your local machine?
You also mentioned, that while it succeeded on your machine, it didn’t work with Github Actions. What errors did you observe logged on Github Actions?
Hi Matt
It completed within few minutes on my local machine, i have tried automatic analysis again after few days of raising the issue and it was same error
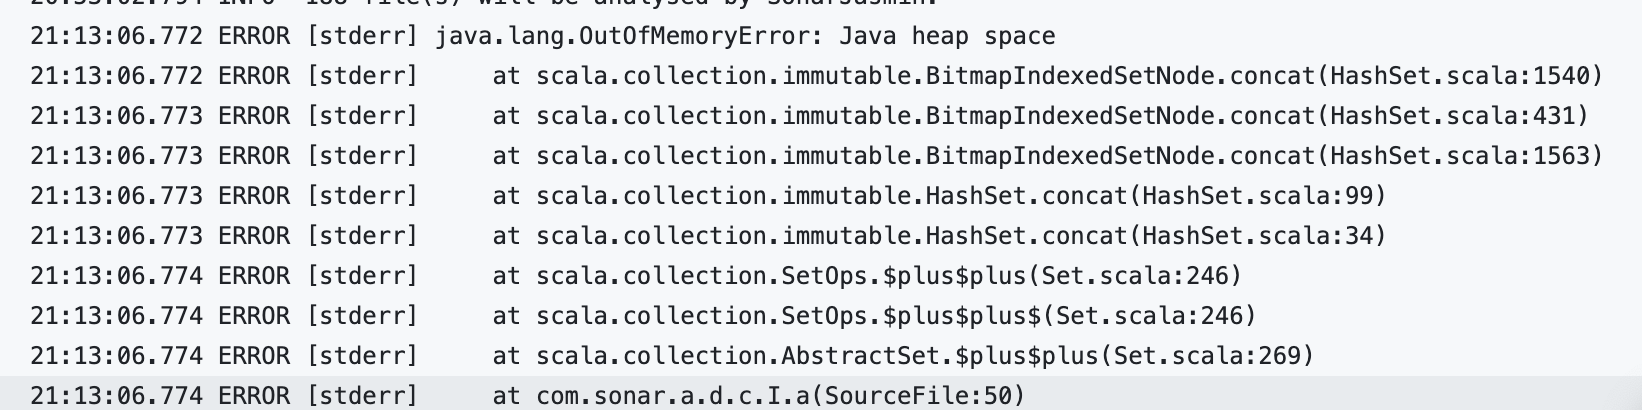
On github actions i have tried with github runner and self hosted runne on both am getting
java OutOfMemoryError
I will try again the automatic analysis today and will let you know the outcome
Hi Matt,
Automatic analysis failed again
Your analysis with ID “071b86e6-8ebf-4c3f-8363-ddf75b5680e8” has failed because it took too much time. Please try another CI tool to analyze your project.
Hi Matt,
Please let me know if you got chance to look at the above issue, its hampering the development
Thank you for all the information.
You project is large enough to require more than standard memory allocation for Java Heap.
While you cannot customize Java Heap memory on Automatic Analysis, you should be able to configure it for CI-based analysis.
There is an Environment Variable called SONAR_SCANNER_JAVA_OPTSthat will accept -Xmx JVM argument, and it will help you set the Java Heap space.
Please see the “Throubleshooting” section , where you can find an example.
1 Like
Hi Matt,
As per your suggestion even after adding the java heap upto 4GB, its been more than 2:30 hours, still the scan is running and it took less than 5 min on local system
SONAR_SCANNER_JAVA_OPTS: “-Xmx4g”
Hi,
It’s probably time to look hard at the difference between the two systems.
Additionally, a debug log (-Dsonar.verbose=true on the analysis command line) could help pinpoint where the timing differences are.
HTH,
Ann
Hi,
Thanks for prompt response, added the debug log and found that its getting stuck on two files


then added both files under exclusion for testing and scan got completed on github actions CI within 5 min
sonar.exclusions=**/server.js,**/routes/v1/email*.js
am not from coding background, can you suggest what could be wrong with these files, let me know if further details required
Hi,
Would you be willing to share those files, either publicly or privately?
Also, what’s the difference in environment between your localhost and GitHub Actions? E.G. the Node.js version (at a guess) could be playing a part here.
Ann