Hello everyone,
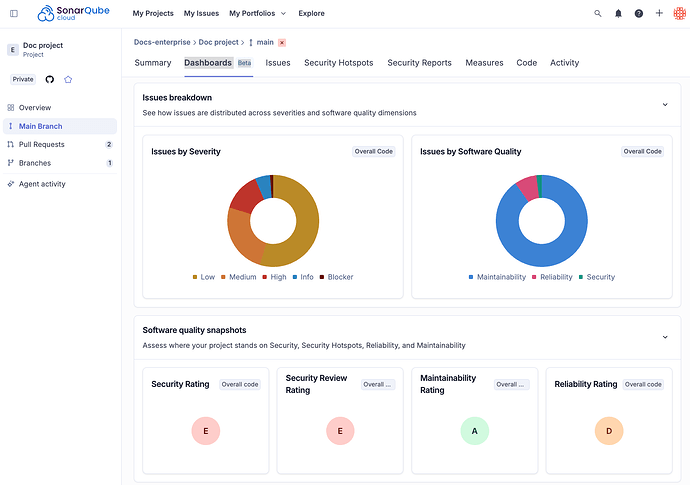
We are thrilled to announce we are beginning the progressive rollout of the beta for a brand-new capability in SonarQube Cloud: customizable project dashboards!
We know that getting a simple, real-time answer to “Are we okay?” can be difficult. Your most important data can feel trapped in different views, forcing teams into slow, manual data gathering for reporting and compliance.
This highly requested feature provides Engineering Managers, Tech Leads, and Security Champions with a single, trusted source of truth. It’s designed to give you at-a-glance clarity to monitor key metrics, identify risks, and communicate progress - all from one configurable and actionable place.
What’s in this beta?
- Project health dashboard: We’ve added a built-in dashboard to every project, giving you an immediate, consolidated view of key health metrics (Security, Reliability, Maintainability, Coverage, and so on).
- Create your own dashboards: You can now build and save your own custom project dashboards. Pick the metrics that matter most to your team and visualize them your way.
- A library of widgets: Start building with a core set of visualizations, including line graphs (for historical data), donut charts, counts, and ratings, covering all existing project measures → we will continue to expand our widget options and metrics iteratively.
- Dashboard management: A new central “All dashboards” page will allow you to view, edit, duplicate, and delete all your custom dashboards.
Where to find it
A quick note on the beta rollout: To ensure a smooth and stable release, we are rolling this feature out progressively. The rollout is beginning now and will continue over the next few weeks based on users. If you don’t see the “Dashboards” menu in your project yet, don’t worry - it’s on its way!
Dashboards will be available to our Enterprise customers. Navigate to any project in SonarQube Cloud. You will see a new Dashboards item in the project-level menu of your Main Branch Summary. From there, you can view the built-in Project health dashboard or start creating your own.
 This is a beta (and just the beginning!)
This beta release is a foundation that will allow us to deliver much more in the future. For this initial release, we’ve focused on project-level dashboards with the existing metrics that you know.
To set expectations, here are a few things not included in this beta (but on our radar):
- SonarQube Server (SQS): This beta is available for SonarQube Cloud only but will be planned for early 2026 for SQS.
- Portfolio-level dashboards: The beta is focused on the project level only. Let us know what you expect for portfolios in comments below.
- Exports & integrations: PDF/CSV export is not part of this beta.
- Alerts & advanced widgets: Notifications, alerts, and advanced widgets (like tables/lists or widgets with multiple measures) are being investigated.
This is a beta, so your feedback is more important than ever! We want to hear what’s working, what’s missing, and which widgets or pre-built dashboards you’d like to see next.
Share your thoughts in the comments or book some time to talk with me: Calendar Booking Link
-Simone
