We are using SonarQube Enterprise v10.5 deployed as a Helm chart to AKS cluster.
We configured 6 CE workers, but still only seeing one background job being processed at a time, with lots of pending tasks accumulating in the queue every day.
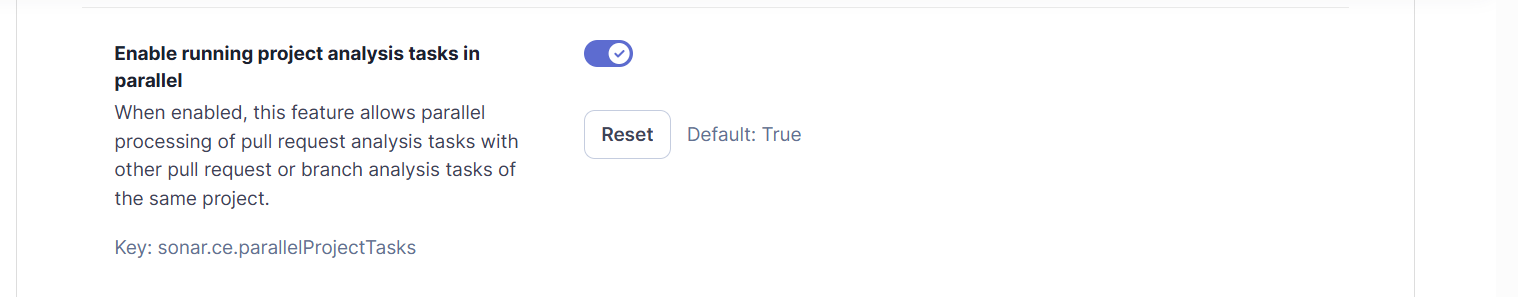
It looks like whatever worker count we select in the UI has absolutely no effect in how SonarQube processes the tasks.
The deployment itself is not resource constrainted, it has plently of room in both CPU and memory.
We currently gave it 2 CPU cores and 10GB ram, but it only uses 0.2 cores and 4.6GB RAM.
We’ve adjusted javaOptions for web, ce and search like so:
sonar.ce.javaOpts: -Xmx2G -Xms128m
sonar.web.javaOpts: -Xmx1G -Xms128m
sonar.search.javaOpts: -Xmx2G -Xms2G -XX:MaxDirectMemorySize=1G
How can we configure it to run mutiple jobs in parallel to speed up analysis?
Hi Colin
It’s the same project with multiple PRs from dev teams.
We are also seeing huge variantions in these jobs - some taking 3.5 hours, some take 5 minutes.
Currently sitting at 27 pending jobs with 315 minutes pending time
We are facing a similar issue with SonarQube DCE v2025.1.3 Enterprise Edition. We have two application pods with a setup of five workers and CE parallelism is also enabled . However, we’ve observed that only one job is in progress while the other two remain in a pending state. Once the job in progress completes, the next one begins.