Since yesterday our CI pipelines started to hang and they were stucked on this line during the Sonar cloud analysis.
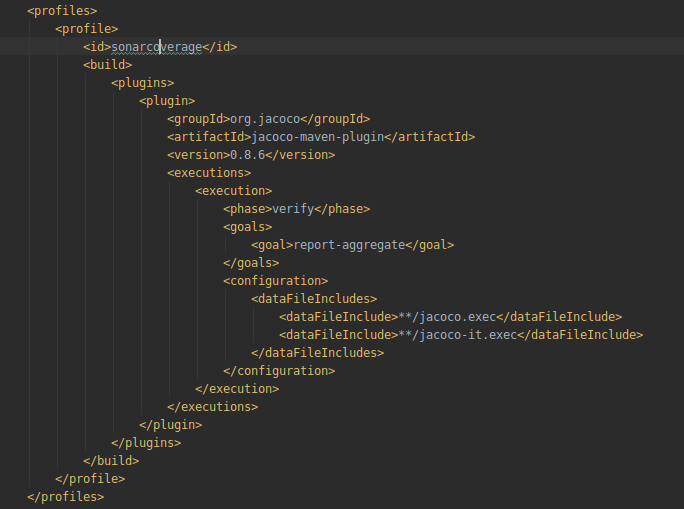
We have a multi-maven Java project with this configuration:
We deployed a new analyzer for Java.
We expect that it can detect new kinds of bugs and, of course, that comes with some impact on analysis performance.
Based on our tests, that should be less than 10% for most projects.
We would really interested to know more about your project and to investigate it.
If that’s blocking you, you may use an internal property to disable the new analyzer, its name is sonar.internal.analysis.dbd.
When calling the mvn command, you can add:
One of our projects is also timing out also even (after increasing timeout to 90mins) when performing Maven based analysis from CircleCI. Overriding the property worked for us.
If there are any details you would like on the project to help develop the analyzer, please let me know.
When there is a new analyzer, this information should be a prominent part of the log output, along with how to revert. I can tell you that when CI builds stop working and nobody on our end changed anything that would cause it to break, having to post here and hope that someone answers is not a great user experience.
Thanks for reporting those performance problems.
If you want to help us investigate:
Please share with us what are the memory settings on your CI machine
If your project is open source, please put a link to it so that we can directly reproduce the performance problem
If your project is private, you could share with us privately the content of ir/java generated folder ( you should see the full path from the analysis logs, something like Reading IR files from /agent/_work/53/s/target/sonar/ir/java)
cWe are also facing the same issue, we have 11 pull requests initiated by snyk that executed for a default runtime of 360 minutes per pull request and used all our free minutes and subscribed to another 4000 paid minutes and the issue still persisted. Finally we are able to execute it by adding the below command after the mvn -Dsonar.internal.analysis.dbd=false.
What is the root cause of the issue, do we need to continue to apply the above or a fix will be released in the future. How can we report this to Sonar Cloud to fix it.
We have now identified the cause of the problem and are working on a fix. We don’t yet have an ETA, but it won’t be this week. We will post an update in this thread when the fix is ready.
Again we thank you for your reports and your patience.
I am also experiencing the same issue since 05/09 and I’m glad I found this thread as I initially thought it was an issue from GitHub build machines or from my code base.
here are the logs showing how loooonnnnnggg it takes
A fix has now been deployed to SonarCloud. We would appreciate if everyone who has been affected by the problem can remove the -Dsonar.internal.analysis.dbd=false option and let us know whether you’re still experiencing any issues.
Thank you again for your reports and your patience.