Hi!
We don’t know what happened, but there is a big increase in time for executing the SonarCloudAnalyze step in our pipeline.
As you can see on the screen below, there is a change in time (around 20 minutes) on 11.10.2023 r.

During that time, we didn’t change anything big or didn’t add lots of new code, so we assume it was a change on the SonarCloud side.
Unfortunately, I don’t have logs from that exact moment, but I can compare one from 23.08 and 8.11.
Some compare screenshots are below:

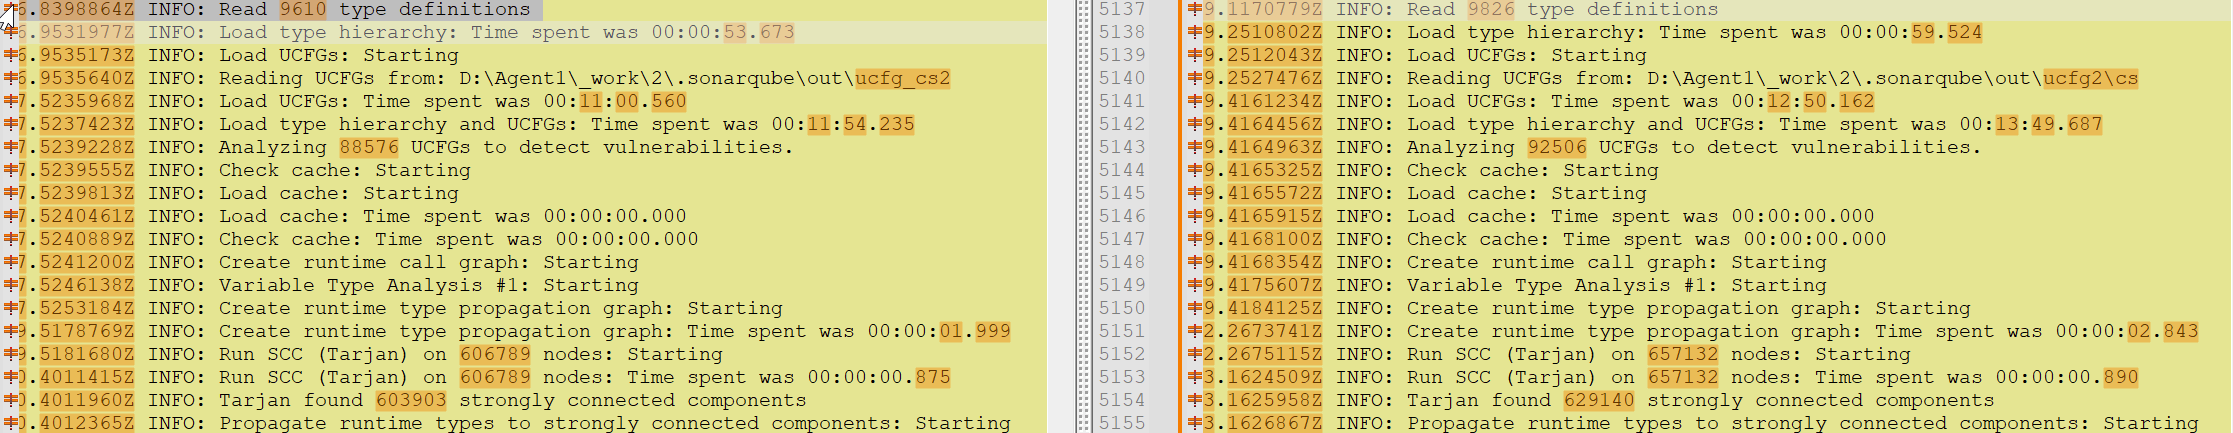


Old log:
2023-08-23T04:47:42.3975033Z ##[section]Starting: SonarCloudAnalyze
2023-08-23T04:47:42.4402763Z ==============================================================================
2023-08-23T04:47:42.4402949Z Task         : Run Code Analysis
2023-08-23T04:47:42.4403041Z Description  : Run scanner and upload the results to the SonarCloud server.
2023-08-23T04:47:42.4403142Z Version      : 1.41.0
2023-08-23T04:47:42.4403213Z Author       : sonarsource
2023-08-23T04:47:42.4403292Z Help         : Version: 1.41.0. This task is not needed for Maven and Gradle projects since the scanner should be run as part of the build.
[More Information](https://docs.sonarcloud.io/advanced-setup/ci-based-analysis/sonarcloud-extension-for-azure-devops/)
2023-08-23T04:47:42.4403572Z ==============================================================================
2023-08-23T04:47:45.9974055Z [command]D:\Agent1\_work\_tasks\SonarCloudPrepare_14d9cde6-c1da-4d55-aa01-2965cd301255\1.38.0\classic-sonar-scanner-msbuild\SonarScanner.MSBuild.exe end
2023-08-23T04:47:46.3898417Z SonarScanner for MSBuild 5.13
2023-08-23T04:47:46.3901889Z Using the .NET Framework version of the Scanner for MSBuild
2023-08-23T04:47:46.5200091Z Post-processing started.
2023-08-23T04:47:52.5580418Z Calling the TFS Processor executable...
2023-08-23T04:47:52.9093739Z Attempting to locate the CodeCoverage.exe tool...
2023-08-23T04:47:52.9509080Z Attempting to locate the CodeCoverage.exe tool using setup configuration...
2023-08-23T04:47:53.0082064Z Attempting to locate the CodeCoverage.exe tool using registry...
2023-08-23T04:47:53.0203798Z WARNING: Failed to find the code coverage command line tool. Possible cause: Visual Studio is not installed, or the installed version does not support code coverage.
2023-08-23T04:47:53.0537669Z The TFS Processor has finished
2023-08-23T04:47:53.0588353Z Calling the SonarScanner CLI...
2023-08-23T04:47:53.8547960Z INFO: Scanner configuration file: D:\Agent1\_work\_tasks\SonarCloudPrepare_14d9cde6-c1da-4d55-aa01-2965cd301255\1.38.0\classic-sonar-scanner-msbuild\sonar-scanner-4.8.0.2856\bin\..\conf\sonar-scanner.properties
2023-08-23T04:47:53.8657898Z INFO: Project root configuration file: D:\Agent1\_work\2\.sonarqube\out\sonar-project.properties
2023-08-23T04:47:54.0562316Z INFO: SonarScanner 4.8.0.2856
2023-08-23T04:47:54.0562840Z INFO: Java 17.0.8 Azul Systems, Inc. (64-bit)
2023-08-23T04:47:54.0563179Z INFO: Windows Server 2019 10.0 amd64
2023-08-23T04:47:54.7396628Z INFO: User cache: C:\Users\adosvc\.sonar\cache
2023-08-23T04:47:57.0564689Z INFO: Analyzing on SonarCloud
2023-08-23T04:47:57.0654483Z INFO: Default locale: "en_US", source code encoding: "windows-1252" (analysis is platform dependent)
2023-08-23T04:47:57.7065047Z INFO: Load global settings
2023-08-23T04:47:57.9552361Z INFO: Load global settings (done) | time=248ms
2023-08-23T04:47:57.9600515Z INFO: Server id:
2023-08-23T04:47:57.9802290Z INFO: User cache: C:\Users\adosvc\.sonar\cache
2023-08-23T04:47:57.9904918Z INFO: Load/download plugins
2023-08-23T04:47:57.9905341Z INFO: Load plugins index
2023-08-23T04:47:58.2254124Z INFO: Load plugins index (done) | time=245ms
2023-08-23T04:47:58.9642099Z INFO: Load/download plugins (done) | time=974ms
2023-08-23T04:47:59.4245879Z INFO: Loaded core extensions: developer-scanner
2023-08-23T04:48:00.2698822Z INFO: Found an active CI vendor: 'Azure DevOps'
2023-08-23T04:48:00.2863544Z INFO: Load project settings for component key: ''
2023-08-23T04:48:00.4727808Z INFO: Load project settings for component key: '' (done) | time=186ms
2023-08-23T04:48:00.4833184Z INFO: Process project properties
2023-08-23T04:48:01.0669618Z INFO: Execute project builders
2023-08-23T04:48:02.3651207Z INFO: Execute project builders (done) | time=1298ms
2023-08-23T04:48:02.3780890Z INFO: Project key:
2023-08-23T04:48:02.3781716Z INFO: Base dir: D:\Agent1\_work\2\s
2023-08-23T04:48:02.3782458Z INFO: Working dir: D:\Agent1\_work\2\.sonarqube\out\.sonar
2023-08-23T04:48:03.2153517Z INFO: Load project branches
2023-08-23T04:48:03.4381295Z INFO: Load project branches (done) | time=223ms
2023-08-23T04:48:03.4415151Z INFO: Check ALM binding of project ''
2023-08-23T04:48:03.6119702Z INFO: Detected project binding: BOUND
2023-08-23T04:48:03.6127072Z INFO: Check ALM binding of project '' (done) | time=168ms
2023-08-23T04:48:03.6163536Z INFO: Load project pull requests
2023-08-23T04:48:04.1351799Z INFO: Load project pull requests (done) | time=524ms
2023-08-23T04:48:04.1407753Z INFO: Load branch configuration
2023-08-23T04:48:04.1442348Z INFO: Load branch configuration (done) | time=3ms
2023-08-23T04:48:04.1895499Z INFO: Load quality profiles
2023-08-23T04:48:04.4266890Z INFO: Load quality profiles (done) | time=237ms
2023-08-23T04:48:04.4328587Z INFO: Load active rules
2023-08-23T04:48:08.6507354Z INFO: Load active rules (done) | time=4217ms
2023-08-23T05:04:01.8794355Z INFO: Taint analysis for csharp: Starting
2023-08-23T05:04:01.9311231Z INFO: 0 / 32772 UCFGs simulated, memory usage: 1790 MB
2023-08-23T05:04:03.0132172Z INFO: 686 / 32772 UCFGs simulated, memory usage: 1574 MB
2023-08-23T05:04:04.2679987Z INFO: 1362 / 32772 UCFGs simulated, memory usage: 1910 MB
2023-08-23T05:04:05.0708699Z INFO: 1971 / 32772 UCFGs simulated, memory usage: 1889 MB
2023-08-23T05:04:06.0596844Z INFO: 2788 / 32772 UCFGs simulated, memory usage: 1920 MB
2023-08-23T05:04:07.2232144Z INFO: 3464 / 32772 UCFGs simulated, memory usage: 1664 MB
2023-08-23T05:04:09.6478462Z INFO: 3864 / 32772 UCFGs simulated, memory usage: 1734 MB
2023-08-23T05:04:11.0366327Z INFO: 4202 / 32772 UCFGs simulated, memory usage: 1992 MB
2023-08-23T05:04:11.6914796Z INFO: 4953 / 32772 UCFGs simulated, memory usage: 2000 MB
2023-08-23T05:04:13.5435835Z INFO: 5717 / 32772 UCFGs simulated, memory usage: 1762 MB
2023-08-23T05:04:18.3874145Z INFO: 6335 / 32772 UCFGs simulated, memory usage: 1683 MB
2023-08-23T05:04:19.7142245Z INFO: 7074 / 32772 UCFGs simulated, memory usage: 1771 MB
2023-08-23T05:04:24.7761663Z INFO: 7538 / 32772 UCFGs simulated, memory usage: 1759 MB
2023-08-23T05:04:29.5459999Z INFO: 8016 / 32772 UCFGs simulated, memory usage: 1660 MB
2023-08-23T05:04:54.9246984Z INFO: 8320 / 32772 UCFGs simulated, memory usage: 1963 MB
2023-08-23T05:05:05.2052820Z INFO: 9022 / 32772 UCFGs simulated, memory usage: 1698 MB
2023-08-23T05:05:25.1453443Z INFO: 9417 / 32772 UCFGs simulated, memory usage: 1918 MB
2023-08-23T05:05:42.3499127Z INFO: 9873 / 32772 UCFGs simulated, memory usage: 1845 MB
2023-08-23T05:06:02.2820632Z INFO: 10295 / 32772 UCFGs simulated, memory usage: 2030 MB
2023-08-23T05:06:02.7501235Z INFO: Too high simulation costs for sink in D:\Agent1\_work\2\s\src\Handler.cs:113. This sink will not be analyzed any further.
2023-08-23T05:06:07.7455534Z INFO: 10542 / 32772 UCFGs simulated, memory usage: 1844 MB
2023-08-23T05:06:19.1904944Z INFO: 10786 / 32772 UCFGs simulated, memory usage: 2005 MB
2023-08-23T05:06:32.8630497Z INFO: 10943 / 32772 UCFGs simulated, memory usage: 1956 MB
2023-08-23T05:06:36.7797339Z INFO: 11190 / 32772 UCFGs simulated, memory usage: 2021 MB
2023-08-23T05:06:41.8485982Z INFO: 11603 / 32772 UCFGs simulated, memory usage: 2072 MB
2023-08-23T05:06:46.0814111Z INFO: Too high simulation costs for sink in D:\Agent1\_work\2\s\src\Modules.cs:190. This sink will not be analyzed any further.
2023-08-23T05:06:46.0819173Z INFO: Too high simulation costs for sink in D:\Agent1\_work\2\s\src\Modules.cs:188. This sink will not be analyzed any further.
2023-08-23T05:06:46.0821542Z INFO: Too high simulation costs for sink in D:\Agent1\_work\2\s\src\Modules.cs:164. This sink will not be analyzed any further.
2023-08-23T05:06:48.5835694Z INFO: 12071 / 32772 UCFGs simulated, memory usage: 2150 MB
2023-08-23T05:06:50.6187803Z INFO: Too high simulation costs for sink in D:\Agent1\_work\2\s\src\Modules.cs:166. This sink will not be analyzed any further.
2023-08-23T05:06:54.0342594Z INFO: Too high simulation costs for sink in D:\Agent1\_work\2\s\src\Modules.cs:666. This sink will not be analyzed any further.
2023-08-23T05:06:56.4528036Z INFO: Too high simulation costs for sink in D:\Agent1\_work\2\s\src\Modules.cs:241. This sink will not be analyzed any further.
2023-08-23T05:06:56.4529226Z INFO: Too high simulation costs for sink in D:\Agent1\_work\2\s\src\FileHelper.cs:11. This sink will not be analyzed any further.
2023-08-23T05:06:56.4540222Z INFO: Too high simulation costs for sink in D:\Agent1\_work\2\s\src\Modules.cs:162. This sink will not be analyzed any further.
2023-08-23T05:06:56.4767460Z INFO: Too high simulation costs for sink in D:\Agent1\_work\2\s\src\Modules.cs:665. This sink will not be analyzed any further.
2023-08-23T05:06:56.4775879Z INFO: Too high simulation costs for sink in D:\Agent1\_work\2\s\src\Modules.cs:109. This sink will not be analyzed any further.
2023-08-23T05:07:01.9800433Z INFO: 12314 / 32772 UCFGs simulated, memory usage: 2214 MB
2023-08-23T05:07:12.4196975Z INFO: Too high simulation costs for sink in D:\Agent1\_work\2\s\src\Task.cs:733. This sink will not be analyzed any further.
2023-08-23T05:07:18.9825141Z INFO: 12824 / 32772 UCFGs simulated, memory usage: 1945 MB
2023-08-23T05:07:29.1625653Z INFO: 13185 / 32772 UCFGs simulated, memory usage: 2136 MB
2023-08-23T05:07:48.3727084Z INFO: 13413 / 32772 UCFGs simulated, memory usage: 2076 MB
2023-08-23T05:07:59.3957996Z INFO: 13704 / 32772 UCFGs simulated, memory usage: 2592 MB
2023-08-23T05:08:10.6504594Z INFO: 13923 / 32772 UCFGs simulated, memory usage: 2130 MB
2023-08-23T05:08:15.5762958Z INFO: 14054 / 32772 UCFGs simulated, memory usage: 1582 MB
2023-08-23T05:08:24.5901705Z INFO: 15004 / 32772 UCFGs simulated, memory usage: 2448 MB
2023-08-23T05:08:27.5649096Z INFO: 16219 / 32772 UCFGs simulated, memory usage: 1923 MB
2023-08-23T05:08:32.3883193Z INFO: 16981 / 32772 UCFGs simulated, memory usage: 1907 MB
2023-08-23T05:08:48.6085718Z INFO: 17588 / 32772 UCFGs simulated, memory usage: 2583 MB
2023-08-23T05:09:05.0062258Z INFO: 18389 / 32772 UCFGs simulated, memory usage: 1813 MB
2023-08-23T05:09:09.0692218Z INFO: 19422 / 32772 UCFGs simulated, memory usage: 2409 MB
2023-08-23T05:09:15.3538655Z INFO: 20496 / 32772 UCFGs simulated, memory usage: 2534 MB
2023-08-23T05:09:25.6806403Z INFO: 21217 / 32772 UCFGs simulated, memory usage: 2539 MB
2023-08-23T05:09:26.3237209Z INFO: 22083 / 32772 UCFGs simulated, memory usage: 1850 MB
2023-08-23T05:09:39.1828861Z INFO: 22558 / 32772 UCFGs simulated, memory usage: 1986 MB
2023-08-23T05:09:53.5356914Z INFO: 23151 / 32772 UCFGs simulated, memory usage: 2584 MB
2023-08-23T05:09:55.7843123Z INFO: 24001 / 32772 UCFGs simulated, memory usage: 2138 MB
2023-08-23T05:10:06.6737095Z INFO: 24967 / 32772 UCFGs simulated, memory usage: 2488 MB
2023-08-23T05:10:34.5674403Z INFO: 25905 / 32772 UCFGs simulated, memory usage: 2148 MB
2023-08-23T05:11:33.5164023Z INFO: 26597 / 32772 UCFGs simulated, memory usage: 2571 MB
2023-08-23T05:11:35.1116774Z INFO: 27795 / 32772 UCFGs simulated, memory usage: 1907 MB
2023-08-23T05:11:51.5663503Z INFO: 28274 / 32772 UCFGs simulated, memory usage: 2651 MB
2023-08-23T05:11:56.8644659Z INFO: 28694 / 32772 UCFGs simulated, memory usage: 1844 MB
2023-08-23T05:12:02.3510325Z INFO: 29123 / 32772 UCFGs simulated, memory usage: 2450 MB
2023-08-23T05:12:54.2152089Z INFO: 29404 / 32772 UCFGs simulated, memory usage: 2600 MB
2023-08-23T05:13:39.9733690Z INFO: 29616 / 32772 UCFGs simulated, memory usage: 2082 MB
2023-08-23T05:14:25.8563146Z INFO: 29811 / 32772 UCFGs simulated, memory usage: 2539 MB
2023-08-23T05:14:50.4980466Z INFO: 30221 / 32772 UCFGs simulated, memory usage: 1920 MB
2023-08-23T05:15:18.0347907Z INFO: 30622 / 32772 UCFGs simulated, memory usage: 2088 MB
2023-08-23T05:15:35.3069626Z INFO: 31007 / 32772 UCFGs simulated, memory usage: 2437 MB
2023-08-23T05:16:34.7979043Z INFO: 31171 / 32772 UCFGs simulated, memory usage: 2299 MB
2023-08-23T05:17:04.0529441Z INFO: 31618 / 32772 UCFGs simulated, memory usage: 2366 MB
2023-08-23T05:17:20.1247494Z INFO: 31875 / 32772 UCFGs simulated, memory usage: 2097 MB
2023-08-23T05:17:29.2158178Z INFO: 32219 / 32772 UCFGs simulated, memory usage: 2600 MB
2023-08-23T05:17:44.7067403Z INFO: 32482 / 32772 UCFGs simulated, memory usage: 2525 MB
2023-08-23T05:18:06.4684557Z INFO: 32654 / 32772 UCFGs simulated, memory usage: 2222 MB
2023-08-23T05:18:09.7826900Z INFO: 32746 / 32772 UCFGs simulated, memory usage: 2665 MB
2023-08-23T05:18:09.7827476Z INFO: Taint analysis for csharp: Time spent was 00:14:07.903
2023-08-23T05:18:09.7827847Z INFO: Report issues: Starting
2023-08-23T05:18:17.9133666Z INFO: Report issues: Time spent was 00:00:08.124
2023-08-23T05:18:17.9134060Z INFO: Store cache: Starting
2023-08-23T05:18:18.0916117Z INFO: Store cache: Time spent was 00:00:00.187
2023-08-23T05:18:18.0916615Z INFO: csharp security sensor: Time spent was 00:26:44.811
2023-08-23T05:18:18.0926872Z INFO: csharp security sensor: Begin: 2023-08-23T04:51:33.277565700Z, End: 2023-08-23T05:18:18.088981600Z, Duration: 00:26:44.811
2023-08-23T05:18:18.0927502Z   Load type hierarchy and UCFGs: Begin: 2023-08-23T04:51:33.277565700Z, End: 2023-08-23T05:03:27.513208800Z, Duration: 00:11:54.235
2023-08-23T05:18:18.0927997Z     Load type hierarchy: Begin: 2023-08-23T04:51:33.277565700Z, End: 2023-08-23T04:52:26.951558500Z, Duration: 00:00:53.673
2023-08-23T05:18:18.0929309Z     Load UCFGs: Begin: 2023-08-23T04:52:26.952557300Z, End: 2023-08-23T05:03:27.513208800Z, Duration: 00:11:00.560
2023-08-23T05:18:18.0929807Z   Check cache: Begin: 2023-08-23T05:03:27.513208800Z, End: 2023-08-23T05:03:27.513208800Z, Duration: 00:00:00.000
2023-08-23T05:18:18.0950837Z     Load cache: Begin: 2023-08-23T05:03:27.513208800Z, End: 2023-08-23T05:03:27.513208800Z, Duration: 00:00:00.000
2023-08-23T05:18:18.0951487Z   Create runtime call graph: Begin: 2023-08-23T05:03:27.513208800Z, End: 2023-08-23T05:03:35.513203700Z, Duration: 00:00:07.999
2023-08-23T05:18:18.0952156Z     Variable Type Analysis #1: Begin: 2023-08-23T05:03:27.513208800Z, End: 2023-08-23T05:03:31.638212400Z, Duration: 00:00:04.125
2023-08-23T05:18:18.0953910Z       Create runtime type propagation graph: Begin: 2023-08-23T05:03:27.513208800Z, End: 2023-08-23T05:03:29.513203400Z, Duration: 00:00:01.999
2023-08-23T05:18:18.0954680Z       Run SCC (Tarjan) on 606789 nodes: Begin: 2023-08-23T05:03:29.513203400Z, End: 2023-08-23T05:03:30.388209100Z, Duration: 00:00:00.875
2023-08-23T05:18:18.0955337Z       Propagate runtime types to strongly connected components: Begin: 2023-08-23T05:03:30.388209100Z, End: 2023-08-23T05:03:31.638212400Z, Duration: 00:00:01.250
2023-08-23T05:18:18.0955953Z     Variable Type Analysis #2: Begin: 2023-08-23T05:03:31.653831100Z, End: 2023-08-23T05:03:35.450705900Z, Duration: 00:00:03.796
2023-08-23T05:18:18.0956549Z       Create runtime type propagation graph: Begin: 2023-08-23T05:03:31.653831100Z, End: 2023-08-23T05:03:33.528838600Z, Duration: 00:00:01.875
2023-08-23T05:18:18.0957200Z       Run SCC (Tarjan) on 606738 nodes: Begin: 2023-08-23T05:03:33.528838600Z, End: 2023-08-23T05:03:34.231954700Z, Duration: 00:00:00.703
2023-08-23T05:18:18.0958517Z       Propagate runtime types to strongly connected components: Begin: 2023-08-23T05:03:34.231954700Z, End: 2023-08-23T05:03:35.450705900Z, Duration: 00:00:01.218
2023-08-23T05:18:18.0959136Z   Load config: Begin: 2023-08-23T05:03:35.513203700Z, End: 2023-08-23T05:03:35.685088700Z, Duration: 00:00:00.171
2023-08-23T05:18:18.0959970Z   Compute entry points: Begin: 2023-08-23T05:03:35.685088700Z, End: 2023-08-23T05:03:55.247586800Z, Duration: 00:00:19.562
2023-08-23T05:18:18.0960523Z   Slice call graph: Begin: 2023-08-23T05:03:55.247586800Z, End: 2023-08-23T05:03:56.278833600Z, Duration: 00:00:01.031
2023-08-23T05:18:18.0960922Z   Live variable analysis: Begin: 2023-08-23T05:03:56.278833600Z, End: 2023-08-23T05:04:01.872586300Z, Duration: 00:00:05.593
2023-08-23T05:18:18.0961399Z   Taint analysis for csharp: Begin: 2023-08-23T05:04:01.872586300Z, End: 2023-08-23T05:18:09.776486700Z, Duration: 00:14:07.903
2023-08-23T05:18:18.0961772Z   Report issues: Begin: 2023-08-23T05:18:09.776486700Z, End: 2023-08-23T05:18:17.901482900Z, Duration: 00:00:08.124
2023-08-23T05:18:18.0962241Z   Store cache: Begin: 2023-08-23T05:18:17.901482900Z, End: 2023-08-23T05:18:18.088981600Z, Duration: 00:00:00.187
2023-08-23T05:18:18.0962636Z INFO: csharp security sensor peak memory: 3643 MB
2023-08-23T05:18:18.0962949Z INFO: Sensor CSharpSecuritySensor [security] (done) | time=1604811ms
2023-08-23T05:18:18.0963228Z INFO: Sensor PhpSecuritySensor [security]
2023-08-23T05:18:18.0963609Z INFO: Enabled taint analysis rules: S2076, S2078, S2083, S2091, S2631, S3649, S5131, S5135, S5144, S5145, S5146, S5334, S5335, S5883, S6173, S6287, S6350
2023-08-23T05:18:18.0963981Z INFO: Load type hierarchy and UCFGs: Starting
2023-08-23T05:18:18.0964212Z INFO: Load type hierarchy: Starting
2023-08-23T05:18:18.0964509Z INFO: Reading type hierarchy from: D:\Agent1\_work\2\.sonarqube\out\.sonar\ucfg2\php
2023-08-23T05:18:18.0964820Z INFO: Read 0 type definitions
2023-08-23T05:18:18.0964999Z INFO: Load type hierarchy: Time spent was 00:00:00.000
2023-08-23T05:18:18.0965173Z INFO: Load UCFGs: Starting
2023-08-23T05:18:18.0965343Z INFO: Load UCFGs: Time spent was 00:00:00.000
2023-08-23T05:18:18.0965532Z INFO: Load type hierarchy and UCFGs: Time spent was 00:00:00.000
2023-08-23T05:18:18.0965730Z INFO: No UCFGs have been included for analysis.
2023-08-23T05:18:18.0965916Z INFO: php security sensor: Time spent was 00:00:00.000
2023-08-23T05:20:58.3029439Z INFO: CPD Executor CPD calculation finished (done) | time=6500ms
2023-08-23T05:21:02.8587378Z INFO: SCM writing changed lines
2023-08-23T05:21:03.1244645Z INFO: SCM writing changed lines (done) | time=266ms
2023-08-23T05:21:06.5609706Z INFO: Analysis report generated in 6140ms, dir size=14 MB
2023-08-23T05:23:07.1082071Z INFO: Analysis report compressed in 120547ms, zip size=8 MB
2023-08-23T05:23:13.0232559Z INFO: Analysis report uploaded in 5922ms
2023-08-23T05:23:13.0259951Z INFO: ANALYSIS SUCCESSFUL, you can find the results at:
2023-08-23T05:23:13.0260429Z INFO: Note that you will be able to access the updated dashboard once the server has processed the submitted analysis report
2023-08-23T05:23:13.0260716Z INFO: More about the report processing at https://sonarcloud.io/api/ce/task?id=AYog2MlwSNP7YUDCvsTl
2023-08-23T05:23:23.9441031Z INFO: Time spent writing ucfgs 12ms
2023-08-23T05:23:27.9764680Z INFO: Analysis total time: 35:28.551 s
2023-08-23T05:23:27.9878678Z INFO: ------------------------------------------------------------------------
2023-08-23T05:23:27.9879133Z INFO: EXECUTION SUCCESS
2023-08-23T05:23:27.9879486Z INFO: ------------------------------------------------------------------------
2023-08-23T05:23:27.9879880Z INFO: Total time: 35:34.160s
2023-08-23T05:23:28.6109008Z INFO: Final Memory: 813M/2740M
2023-08-23T05:23:28.6109382Z INFO: ------------------------------------------------------------------------
2023-08-23T05:23:29.5609458Z The SonarScanner CLI has finished
2023-08-23T05:23:29.5612739Z 07:23:29.559  Post-processing succeeded.
2023-08-23T05:23:29.6227022Z ##[section]Finishing: SonarCloudAnalyze
New log:
2023-11-08T12:28:39.5685099Z ##[section]Starting: SonarCloudAnalyze
2023-11-08T12:28:39.6123067Z ==============================================================================
2023-11-08T12:28:39.6123247Z Task         : Run Code Analysis
2023-11-08T12:28:39.6123342Z Description  : Run scanner and upload the results to the SonarCloud server.
2023-11-08T12:28:39.6123442Z Version      : 1.43.2
2023-11-08T12:28:39.6123511Z Author       : sonarsource
2023-11-08T12:28:39.6123598Z Help         : Version: 1.43.2. This task is not needed for Maven and Gradle projects since the scanner should be run as part of the build.

[More Information](https://docs.sonarcloud.io/advanced-setup/ci-based-analysis/sonarcloud-extension-for-azure-devops/)
2023-11-08T12:28:39.6126826Z ==============================================================================
2023-11-08T12:28:42.5808830Z [command]D:\Agent1\_work\_tasks\SonarCloudPrepare_14d9cde6-c1da-4d55-aa01-2965cd301255\1.40.2\classic-sonar-scanner-msbuild\SonarScanner.MSBuild.exe end
2023-11-08T12:28:42.7743857Z SonarScanner for MSBuild 5.14
2023-11-08T12:28:42.7745814Z Using the .NET Framework version of the Scanner for MSBuild
2023-11-08T12:28:42.8633351Z Post-processing started.
2023-11-08T12:28:48.7610839Z Calling the TFS Processor executable...
2023-11-08T12:28:49.0182256Z Attempting to locate the CodeCoverage.exe tool...
2023-11-08T12:28:49.0206027Z Attempting to locate the CodeCoverage.exe tool using setup configuration...
2023-11-08T12:28:49.0527941Z Attempting to locate the CodeCoverage.exe tool using registry...
2023-11-08T12:28:49.0586802Z WARNING: Failed to find the code coverage command line tool. Possible cause: Visual Studio is not installed, or the installed version does not support code coverage.
2023-11-08T12:28:49.0695401Z The TFS Processor has finished
2023-11-08T12:28:49.0748518Z Calling the SonarScanner CLI...
2023-11-08T12:28:49.7068150Z INFO: Scanner configuration file: D:\Agent1\_work\_tasks\SonarCloudPrepare_14d9cde6-c1da-4d55-aa01-2965cd301255\1.40.2\classic-sonar-scanner-msbuild\sonar-scanner-4.8.1.3023\bin\..\conf\sonar-scanner.properties
2023-11-08T12:28:49.7178107Z INFO: Project root configuration file: D:\Agent1\_work\2\.sonarqube\out\sonar-project.properties
2023-11-08T12:28:49.9043716Z INFO: SonarScanner 4.8.1.3023
2023-11-08T12:28:49.9044737Z INFO: Java 17.0.8 Azul Systems, Inc. (64-bit)
2023-11-08T12:28:49.9044934Z INFO: Windows Server 2019 10.0 amd64
2023-11-08T12:28:50.6224418Z INFO: User cache: C:\Users\adosvc\.sonar\cache
2023-11-08T12:28:51.5741255Z INFO: Analyzing on SonarCloud
2023-11-08T12:28:51.5746682Z INFO: Default locale: "en_US", source code encoding: "windows-1252" (analysis is platform dependent)
2023-11-08T12:28:52.5377557Z INFO: Load global settings
2023-11-08T12:28:53.1345521Z INFO: Load global settings (done) | time=593ms
2023-11-08T12:28:53.1416480Z INFO: Server id:
2023-11-08T12:28:53.1541613Z INFO: User cache: C:\Users\adosvc\.sonar\cache
2023-11-08T12:28:53.1658902Z INFO: Loading required plugins
2023-11-08T12:28:53.1661642Z INFO: Load plugins index
2023-11-08T12:28:53.7430959Z INFO: Load plugins index (done) | time=587ms
2023-11-08T12:28:53.7433956Z INFO: Load/download plugins
2023-11-08T12:28:53.9881147Z INFO: Load/download plugins (done) | time=244ms
2023-11-08T12:28:54.7032329Z INFO: Loaded core extensions: developer-scanner
2023-11-08T12:28:55.4130138Z INFO: Found an active CI vendor: 'Azure DevOps'
2023-11-08T12:28:55.4318013Z INFO: Load project settings for component key: ''
2023-11-08T12:28:55.9310320Z INFO: Load project settings for component key: '' (done) | time=499ms
2023-11-08T12:28:55.9401149Z INFO: Process project properties
2023-11-08T12:28:56.6326481Z INFO: Execute project builders
2023-11-08T12:28:57.8786872Z INFO: Execute project builders (done) | time=1246ms
2023-11-08T12:28:57.8866607Z INFO: Project key:
2023-11-08T12:28:57.8867061Z INFO: Base dir: D:\Agent1\_work\2\s
2023-11-08T12:28:57.8869046Z INFO: Working dir: D:\Agent1\_work\2\.sonarqube\out\.sonar
2023-11-08T12:28:58.7492494Z INFO: Load project branches
2023-11-08T12:28:59.4559575Z INFO: Load project branches (done) | time=706ms
2023-11-08T12:28:59.4587642Z INFO: Check ALM binding of project ''
2023-11-08T12:28:59.9438474Z INFO: Detected project binding: BOUND
2023-11-08T12:28:59.9443338Z INFO: Check ALM binding of project '' (done) | time=489ms
2023-11-08T12:28:59.9519376Z INFO: Load project pull requests
2023-11-08T12:29:00.5427448Z INFO: Load project pull requests (done) | time=590ms
2023-11-08T12:29:00.5468872Z INFO: Load branch configuration
2023-11-08T12:29:01.0877221Z INFO: Load branch configuration (done) | time=542ms
2023-11-08T12:29:01.0974353Z INFO: Load quality profiles
2023-11-08T12:29:01.6742248Z INFO: Load quality profiles (done) | time=577ms
2023-11-08T12:29:01.6879740Z INFO: Load active rules
2023-11-08T12:29:12.4730634Z INFO: Load active rules (done) | time=10786ms
2023-11-08T12:46:14.8650536Z INFO: Taint analysis for csharp: Starting
2023-11-08T12:46:14.8975878Z INFO: 0 / 40697 UCFGs simulated, memory usage: 2170 MB
2023-11-08T12:46:15.8939191Z INFO: 787 / 40697 UCFGs simulated, memory usage: 2373 MB
2023-11-08T12:46:17.3560662Z INFO: 1354 / 40697 UCFGs simulated, memory usage: 1431 MB
2023-11-08T12:46:18.5838118Z INFO: 2117 / 40697 UCFGs simulated, memory usage: 1943 MB
2023-11-08T12:46:21.4776917Z INFO: 2785 / 40697 UCFGs simulated, memory usage: 2161 MB
2023-11-08T12:46:25.0527272Z INFO: 3601 / 40697 UCFGs simulated, memory usage: 2237 MB
2023-11-08T12:46:30.1481607Z INFO: 3866 / 40697 UCFGs simulated, memory usage: 2800 MB
2023-11-08T12:47:55.6806562Z INFO: 4405 / 40697 UCFGs simulated, memory usage: 1785 MB
2023-11-08T12:48:08.2086408Z INFO: 5439 / 40697 UCFGs simulated, memory usage: 1994 MB
2023-11-08T12:48:22.4361546Z INFO: 6007 / 40697 UCFGs simulated, memory usage: 1614 MB
2023-11-08T12:48:25.2174623Z INFO: 6804 / 40697 UCFGs simulated, memory usage: 2080 MB
2023-11-08T12:48:32.6108918Z INFO: 7303 / 40697 UCFGs simulated, memory usage: 2928 MB
2023-11-08T12:48:36.8634019Z INFO: 7845 / 40697 UCFGs simulated, memory usage: 2906 MB
2023-11-08T12:48:39.8310478Z INFO: 8383 / 40697 UCFGs simulated, memory usage: 1741 MB
2023-11-08T12:48:58.7540682Z INFO: 8804 / 40697 UCFGs simulated, memory usage: 1948 MB
2023-11-08T12:49:22.5034126Z INFO: 9256 / 40697 UCFGs simulated, memory usage: 2442 MB
2023-11-08T12:50:11.8245185Z INFO: Too high simulation costs for sink in D:\Agent1\_work\2\s\src\Handler.cs:113. This sink will not be analyzed any further.
2023-11-08T12:50:16.7381494Z INFO: 9578 / 40697 UCFGs simulated, memory usage: 2782 MB
2023-11-08T12:50:35.8553579Z INFO: 9950 / 40697 UCFGs simulated, memory usage: 2737 MB
2023-11-08T12:51:20.0955980Z INFO: 10617 / 40697 UCFGs simulated, memory usage: 2634 MB
2023-11-08T12:52:25.4235674Z INFO: 11054 / 40697 UCFGs simulated, memory usage: 2921 MB
2023-11-08T12:54:11.6804661Z INFO: 11350 / 40697 UCFGs simulated, memory usage: 2613 MB
2023-11-08T12:54:36.8551150Z INFO: 11577 / 40697 UCFGs simulated, memory usage: 2494 MB
2023-11-08T12:54:52.2056252Z INFO: 11831 / 40697 UCFGs simulated, memory usage: 3075 MB
2023-11-08T12:55:59.5140170Z INFO: 12286 / 40697 UCFGs simulated, memory usage: 2701 MB
2023-11-08T12:56:35.3118979Z INFO: 12557 / 40697 UCFGs simulated, memory usage: 2804 MB
2023-11-08T12:56:38.6807865Z INFO: Too high simulation costs for sink in D:\Agent1\_work\2\s\src\Modules.cs:166. This sink will not be analyzed any further.
2023-11-08T12:56:38.6825622Z INFO: Too high simulation costs for sink in D:\Agent1\_work\2\s\src\Modules.cs:164. This sink will not be analyzed any further.
2023-11-08T12:56:38.6830456Z INFO: Too high simulation costs for sink in D:\Agent1\_work\2\s\src\Modules.cs:188. This sink will not be analyzed any further.
2023-11-08T12:56:38.6833041Z INFO: Too high simulation costs for sink in D:\Agent1\_work\2\s\src\Modules.cs:190. This sink will not be analyzed any further.
2023-11-08T12:56:56.2745356Z INFO: 13179 / 40697 UCFGs simulated, memory usage: 2255 MB
2023-11-08T12:57:25.6441690Z INFO: 14081 / 40697 UCFGs simulated, memory usage: 2074 MB
2023-11-08T12:57:29.4653733Z INFO: 15369 / 40697 UCFGs simulated, memory usage: 3197 MB
2023-11-08T12:57:31.3167137Z INFO: Too high simulation costs for sink in D:\Agent1\_work\2\s\src\Modules.cs:666. This sink will not be analyzed any further.
2023-11-08T12:57:36.9238606Z INFO: 16163 / 40697 UCFGs simulated, memory usage: 3123 MB
2023-11-08T12:57:50.7883559Z INFO: Too high simulation costs for sink in D:\Agent1\_work\2\s\src\Modules.cs:109. This sink will not be analyzed any further.
2023-11-08T12:58:16.8400459Z INFO: Too high simulation costs for sink in D:\Agent1\_work\2\s\src\Modules.cs:162. This sink will not be analyzed any further.
2023-11-08T12:58:22.3466388Z INFO: 16779 / 40697 UCFGs simulated, memory usage: 3185 MB
2023-11-08T12:59:24.3242295Z INFO: 17196 / 40697 UCFGs simulated, memory usage: 2371 MB
2023-11-08T12:59:38.0141452Z INFO: 18190 / 40697 UCFGs simulated, memory usage: 3099 MB
2023-11-08T13:00:21.3273833Z INFO: 18690 / 40697 UCFGs simulated, memory usage: 2853 MB
2023-11-08T13:00:28.6641529Z INFO: 19827 / 40697 UCFGs simulated, memory usage: 2738 MB
2023-11-08T13:00:40.1517510Z INFO: 20865 / 40697 UCFGs simulated, memory usage: 3260 MB
2023-11-08T13:01:08.3603930Z INFO: 21506 / 40697 UCFGs simulated, memory usage: 2667 MB
2023-11-08T13:01:11.1495171Z INFO: 22599 / 40697 UCFGs simulated, memory usage: 3331 MB
2023-11-08T13:01:35.8338832Z INFO: Too high simulation costs for sink in D:\Agent1\_work\2\s\src\Modules.cs:665. This sink will not be analyzed any further.
2023-11-08T13:02:24.8258035Z INFO: 22896 / 40697 UCFGs simulated, memory usage: 3146 MB
2023-11-08T13:02:36.2485066Z INFO: 23697 / 40697 UCFGs simulated, memory usage: 2799 MB
2023-11-08T13:02:51.4726209Z INFO: 24749 / 40697 UCFGs simulated, memory usage: 2975 MB
2023-11-08T13:03:42.4792872Z INFO: 25702 / 40697 UCFGs simulated, memory usage: 3030 MB
2023-11-08T13:06:27.5422792Z INFO: 26470 / 40697 UCFGs simulated, memory usage: 2923 MB
2023-11-08T13:08:17.1937893Z INFO: 27607 / 40697 UCFGs simulated, memory usage: 3220 MB
2023-11-08T13:08:19.4311665Z INFO: 28895 / 40697 UCFGs simulated, memory usage: 3199 MB
2023-11-08T13:08:46.5556231Z INFO: Too high simulation costs for sink in D:\Agent1\_work\2\s\src\BL\Task.cs:735. This sink will not be analyzed any further.
2023-11-08T13:08:52.4691771Z INFO: 29614 / 40697 UCFGs simulated, memory usage: 3271 MB
2023-11-08T13:09:43.1308101Z INFO: 30010 / 40697 UCFGs simulated, memory usage: 2895 MB
2023-11-08T13:10:18.8989762Z INFO: 30488 / 40697 UCFGs simulated, memory usage: 3284 MB
2023-11-08T13:10:48.1510078Z INFO: 30865 / 40697 UCFGs simulated, memory usage: 3135 MB
2023-11-08T13:11:09.1418017Z INFO: Too high simulation costs for sink in D:\Agent1\_work\2\s\src\BLFileHelper.cs:11. This sink will not be analyzed any further.
2023-11-08T13:11:35.3263354Z INFO: 31152 / 40697 UCFGs simulated, memory usage: 3511 MB
2023-11-08T13:12:14.9573154Z INFO: 31534 / 40697 UCFGs simulated, memory usage: 3106 MB
2023-11-08T13:12:50.4590948Z INFO: 31974 / 40697 UCFGs simulated, memory usage: 3257 MB
2023-11-08T13:13:13.1944629Z INFO: 32475 / 40697 UCFGs simulated, memory usage: 3592 MB
2023-11-08T13:15:13.8152317Z INFO: 32828 / 40697 UCFGs simulated, memory usage: 3141 MB
2023-11-08T13:17:32.2493755Z INFO: 33112 / 40697 UCFGs simulated, memory usage: 3229 MB
2023-11-08T13:19:46.2148942Z INFO: Too high simulation costs for sink in D:\Agent1\_work\2\s\src\Modules.cs:241. This sink will not be analyzed any further.
2023-11-08T13:19:47.3729113Z INFO: 33354 / 40697 UCFGs simulated, memory usage: 3349 MB
2023-11-08T13:20:53.4720523Z INFO: 33702 / 40697 UCFGs simulated, memory usage: 3400 MB
2023-11-08T13:21:58.6645270Z INFO: 34097 / 40697 UCFGs simulated, memory usage: 3566 MB
2023-11-08T13:22:21.0200767Z INFO: 34603 / 40697 UCFGs simulated, memory usage: 3354 MB
2023-11-08T13:22:26.7238508Z INFO: 35084 / 40697 UCFGs simulated, memory usage: 3558 MB
2023-11-08T13:23:29.4848465Z INFO: 35695 / 40697 UCFGs simulated, memory usage: 3606 MB
2023-11-08T13:24:14.2838417Z INFO: 36133 / 40697 UCFGs simulated, memory usage: 3507 MB
2023-11-08T13:24:31.9161745Z INFO: 36465 / 40697 UCFGs simulated, memory usage: 3643 MB
2023-11-08T13:25:29.3745619Z INFO: 36888 / 40697 UCFGs simulated, memory usage: 3624 MB
2023-11-08T13:25:47.0768717Z INFO: 37370 / 40697 UCFGs simulated, memory usage: 3385 MB
2023-11-08T13:26:01.0119375Z INFO: 37709 / 40697 UCFGs simulated, memory usage: 3655 MB
2023-11-08T13:26:30.6020469Z INFO: 37975 / 40697 UCFGs simulated, memory usage: 3599 MB
2023-11-08T13:27:09.8647251Z INFO: 38190 / 40697 UCFGs simulated, memory usage: 3330 MB
2023-11-08T13:27:49.0227905Z INFO: 38486 / 40697 UCFGs simulated, memory usage: 3396 MB
2023-11-08T13:28:11.4201340Z INFO: 38615 / 40697 UCFGs simulated, memory usage: 3286 MB
2023-11-08T13:28:21.0254670Z INFO: 38697 / 40697 UCFGs simulated, memory usage: 3382 MB
2023-11-08T13:28:32.6744727Z INFO: 39231 / 40697 UCFGs simulated, memory usage: 3336 MB
2023-11-08T13:31:00.1028291Z INFO: 39429 / 40697 UCFGs simulated, memory usage: 3582 MB
2023-11-08T13:31:21.1734840Z INFO: 39917 / 40697 UCFGs simulated, memory usage: 3548 MB
2023-11-08T13:32:06.8156401Z INFO: 40375 / 40697 UCFGs simulated, memory usage: 3321 MB
2023-11-08T13:33:20.0002981Z INFO: 40652 / 40697 UCFGs simulated, memory usage: 3255 MB
2023-11-08T13:33:21.5118150Z INFO: 40669 / 40697 UCFGs simulated, memory usage: 3531 MB
2023-11-08T13:33:21.5120209Z INFO: Taint analysis for csharp: Time spent was 00:47:06.648
2023-11-08T13:33:21.5120860Z INFO: Report issues: Starting
2023-11-08T13:33:35.4728931Z INFO: Report issues: Time spent was 00:00:13.952
2023-11-08T13:33:35.4729644Z INFO: Store cache: Starting
2023-11-08T13:33:35.4730052Z INFO: Store cache: Time spent was 00:00:00.000
2023-11-08T13:33:35.4730483Z INFO: csharp security sensor: Time spent was 01:01:55.733
2023-11-08T13:33:35.4743370Z INFO: csharp security sensor: Begin: 2023-11-08T12:31:39.724500100Z, End: 2023-11-08T13:33:35.457624200Z, Duration: 01:01:55.733
2023-11-08T13:33:35.4746960Z   Load type hierarchy and UCFGs: Begin: 2023-11-08T12:31:39.725500500Z, End: 2023-11-08T12:45:29.413266900Z, Duration: 00:13:49.687
2023-11-08T13:33:35.4747628Z     Load type hierarchy: Begin: 2023-11-08T12:31:39.725500500Z, End: 2023-11-08T12:32:39.250320200Z, Duration: 00:00:59.524
2023-11-08T13:33:35.4748254Z     Load UCFGs: Begin: 2023-11-08T12:32:39.250320200Z, End: 2023-11-08T12:45:29.413266900Z, Duration: 00:12:50.162
2023-11-08T13:33:35.4749236Z   Check cache: Begin: 2023-11-08T12:45:29.413266900Z, End: 2023-11-08T12:45:29.413266900Z, Duration: 00:00:00.000
2023-11-08T13:33:35.4749775Z     Load cache: Begin: 2023-11-08T12:45:29.413266900Z, End: 2023-11-08T12:45:29.413266900Z, Duration: 00:00:00.000
2023-11-08T13:33:35.4751823Z   Create runtime call graph: Begin: 2023-11-08T12:45:29.413266900Z, End: 2023-11-08T12:45:39.304639900Z, Duration: 00:00:09.891
2023-11-08T13:33:35.4752466Z     Variable Type Analysis #1: Begin: 2023-11-08T12:45:29.413266900Z, End: 2023-11-08T12:45:34.850826200Z, Duration: 00:00:05.437
2023-11-08T13:33:35.4753374Z       Create runtime type propagation graph: Begin: 2023-11-08T12:45:29.413266900Z, End: 2023-11-08T12:45:32.257050400Z, Duration: 00:00:02.843
2023-11-08T13:33:35.4753971Z       Run SCC (Tarjan) on 657132 nodes: Begin: 2023-11-08T12:45:32.257050400Z, End: 2023-11-08T12:45:33.147670600Z, Duration: 00:00:00.890
2023-11-08T13:33:35.4754610Z       Propagate runtime types to strongly connected components: Begin: 2023-11-08T12:45:33.147670600Z, End: 2023-11-08T12:45:34.850826200Z, Duration: 00:00:01.703
2023-11-08T13:33:35.4755206Z     Variable Type Analysis #2: Begin: 2023-11-08T12:45:34.866920200Z, End: 2023-11-08T12:45:39.242140100Z, Duration: 00:00:04.375
2023-11-08T13:33:35.4755801Z       Create runtime type propagation graph: Begin: 2023-11-08T12:45:34.866920200Z, End: 2023-11-08T12:45:36.913993400Z, Duration: 00:00:02.047
2023-11-08T13:33:35.4756363Z       Run SCC (Tarjan) on 657091 nodes: Begin: 2023-11-08T12:45:36.913993400Z, End: 2023-11-08T12:45:37.710885800Z, Duration: 00:00:00.796
2023-11-08T13:33:35.4757647Z       Propagate runtime types to strongly connected components: Begin: 2023-11-08T12:45:37.710885800Z, End: 2023-11-08T12:45:39.242140100Z, Duration: 00:00:01.531
2023-11-08T13:33:35.4758610Z   Load config: Begin: 2023-11-08T12:45:39.304639900Z, End: 2023-11-08T12:45:39.476530400Z, Duration: 00:00:00.171
2023-11-08T13:33:35.4759331Z   Compute entry points: Begin: 2023-11-08T12:45:39.476530400Z, End: 2023-11-08T12:46:02.309507600Z, Duration: 00:00:22.832
2023-11-08T13:33:35.4759884Z   Slice call graph: Begin: 2023-11-08T12:46:02.309507600Z, End: 2023-11-08T12:46:03.840767600Z, Duration: 00:00:01.531
2023-11-08T13:33:35.4760476Z   Live variable analysis: Begin: 2023-11-08T12:46:03.840767600Z, End: 2023-11-08T12:46:14.856493900Z, Duration: 00:00:11.015
2023-11-08T13:33:35.4761168Z   Taint analysis for csharp: Begin: 2023-11-08T12:46:14.856493900Z, End: 2023-11-08T13:33:21.504981100Z, Duration: 00:47:06.648
2023-11-08T13:33:35.4761724Z   Report issues: Begin: 2023-11-08T13:33:21.504981100Z, End: 2023-11-08T13:33:35.457624200Z, Duration: 00:00:13.952
2023-11-08T13:33:35.4762229Z   Store cache: Begin: 2023-11-08T13:33:35.457624200Z, End: 2023-11-08T13:33:35.457624200Z, Duration: 00:00:00.000
2023-11-08T13:33:35.4762982Z INFO: csharp security sensor peak memory: 5420 MB
2023-11-08T13:33:35.4763311Z INFO: Sensor CSharpSecuritySensor [security] (done) | time=3715749ms
2023-11-08T13:33:35.4763605Z INFO: Sensor PhpSecuritySensor [security]
2023-11-08T13:33:35.4764091Z INFO: Enabled taint analysis rules: S2076, S2078, S2083, S2091, S2631, S3649, S5131, S5135, S5144, S5145, S5146, S5334, S5335, S5883, S6173, S6287, S6350
2023-11-08T13:33:35.4764864Z INFO: Load type hierarchy and UCFGs: Starting
2023-11-08T13:33:35.4765136Z INFO: Load type hierarchy: Starting
2023-11-08T13:33:35.4765525Z INFO: Reading type hierarchy from: D:\Agent1\_work\2\.sonarqube\out\.sonar\ucfg2\php
2023-11-08T13:33:35.4765899Z INFO: Read 0 type definitions
2023-11-08T13:33:35.4766550Z INFO: Load type hierarchy: Time spent was 00:00:00.000
2023-11-08T13:33:35.4766882Z INFO: Load UCFGs: Starting
2023-11-08T13:33:35.4767273Z INFO: Load UCFGs: Time spent was 00:00:00.000
2023-11-08T13:33:35.4767691Z INFO: Load type hierarchy and UCFGs: Time spent was 00:00:00.000
2023-11-08T13:33:35.4768488Z INFO: No UCFGs have been included for analysis.
2023-11-08T13:33:35.4768893Z INFO: php security sensor: Time spent was 00:00:00.000
2023-11-08T13:34:47.9036010Z INFO: CPD Executor CPD calculation finished (done) | time=7814ms
2023-11-08T13:34:53.5353438Z INFO: SCM writing changed lines
2023-11-08T13:34:53.8828464Z INFO: SCM writing changed lines (done) | time=343ms
2023-11-08T13:34:58.1149726Z INFO: Analysis report generated in 7500ms, dir size=16 MB
2023-11-08T13:37:41.7572201Z INFO: Analysis report compressed in 163642ms, zip size=9 MB
2023-11-08T13:38:03.9626464Z INFO: Analysis report uploaded in 22209ms
2023-11-08T13:38:03.9662526Z INFO: ANALYSIS SUCCESSFUL, you can find the results at:
2023-11-08T13:38:03.9665562Z INFO: Note that you will be able to access the updated dashboard once the server has processed the submitted analysis report
2023-11-08T13:38:03.9665997Z INFO: More about the report processing at https://sonarcloud.io/api/ce/task?id=AYuvJ4BatafkPhUoFofM
2023-11-08T13:38:26.1767762Z INFO: Analysis total time: 1:09:31.470 s

2023-11-08T13:38:26.1814196Z INFO: ------------------------------------------------------------------------
2023-11-08T13:38:26.1820869Z INFO: EXECUTION SUCCESS
2023-11-08T13:38:26.1821384Z INFO: ------------------------------------------------------------------------
2023-11-08T13:38:26.1821701Z INFO: Total time: 1:09:36.489s
2023-11-08T13:38:26.2677706Z INFO: Final Memory: 21M/100M
2023-11-08T13:38:26.2678066Z INFO: ------------------------------------------------------------------------
2023-11-08T13:38:27.4154350Z The SonarScanner CLI has finished
2023-11-08T13:38:27.4155511Z 14:38:27.405  Post-processing succeeded.
2023-11-08T13:38:27.4792700Z ##[section]Finishing: SonarCloudAnalyze
The question is, what has changed and how can we fix that?