we are using Sonar Cloud with Azure Devops Pipelines to analyze our C# Codebase.
Initially Sonar Cloud increased our Build Time from 30 minutes to 1:30 Hours. That´s something we were able to optimize by optimizing the build configuration (setting up parallel build) and utilizing a more powerful Build Server.
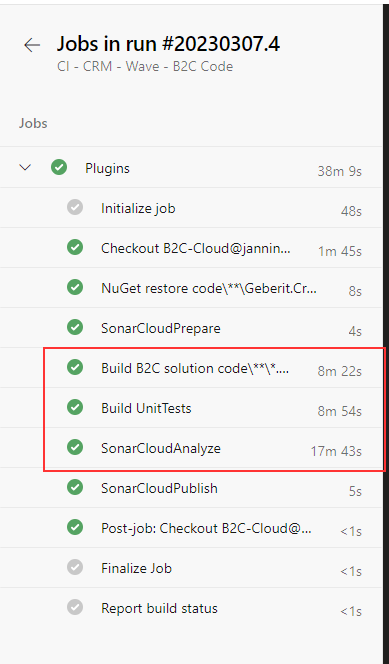
Building our C# Codebase takes now 8 minutes, as a reference, without Sonar Cloud it takes 3minutes and 42seconds.
Building the unit test with Sonar Cloud takes another 9 minutes. Without Sonar Cloud it took 2 minutes.
If there is room for improvement or some best practices we can implement i´ll be happy if you share them with me.
Nevertheless, so far we are happy with the build time approx 15 minutes is acceptable for us and the next step would be to implement quality gates with sonar cloud.
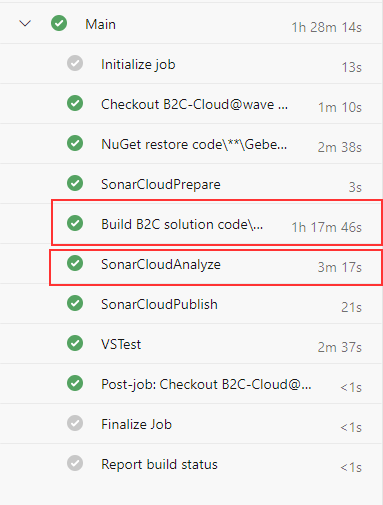
But there is now the “Sonar Cloud Analyze” step which now suddenly takes up to 18 minutes to finish. (Before changing our Build to parrallel execution and a different Build Server the “Sonar Cloud Analyze” step took only 3 minutes). This step increases our overall pipeline execution time to over half an hour. Before implementing quality gates we would like to reduce the “Sonar Cloud Analyze” run time.
How can we improve the run time of the “Sonar Cloud Analyze” step? I am happy to provide the diagnostic logs, but would like to do this privately if possible.
thank you very much for reaching out.
I´ll provide you the logs via private message.
s
Yes, Building the Unit Tests was included in this steps. What we did in the second pipeline → We separated the Build of the normal Code and Unit Tests to be able to run a parrallel build. Because if we run it before separation it would fail because Projects had cross references to each other and expected to be build one after another.
Almost all of the time in the SonarCloudAnalyze step is being spent in the component that detects security issues in C#. I’ve asked the security analyzer team to take a look.
310590 type definitions is quite a lot. Could you share with me the size of the codebase you are trying to analyzing, in LOC? In the SonarCloud interface, in the Overview tab your project, you should see something like _ xyz Lines of Code_ in the upper right corner. What is xyz for your project?
A lot of UCFGs are excluded due to duplicate method ids. This is suspicious and would need to be investigated. For this, however, I would require the contents of the C:\agent\_work\2\.sonarqube\out\ucfg_cs2 folder. Could you zip it and send it to me? I will reach out privately to you for this.