POST https://api.sonarcloud.io/analysis/analyses timeout

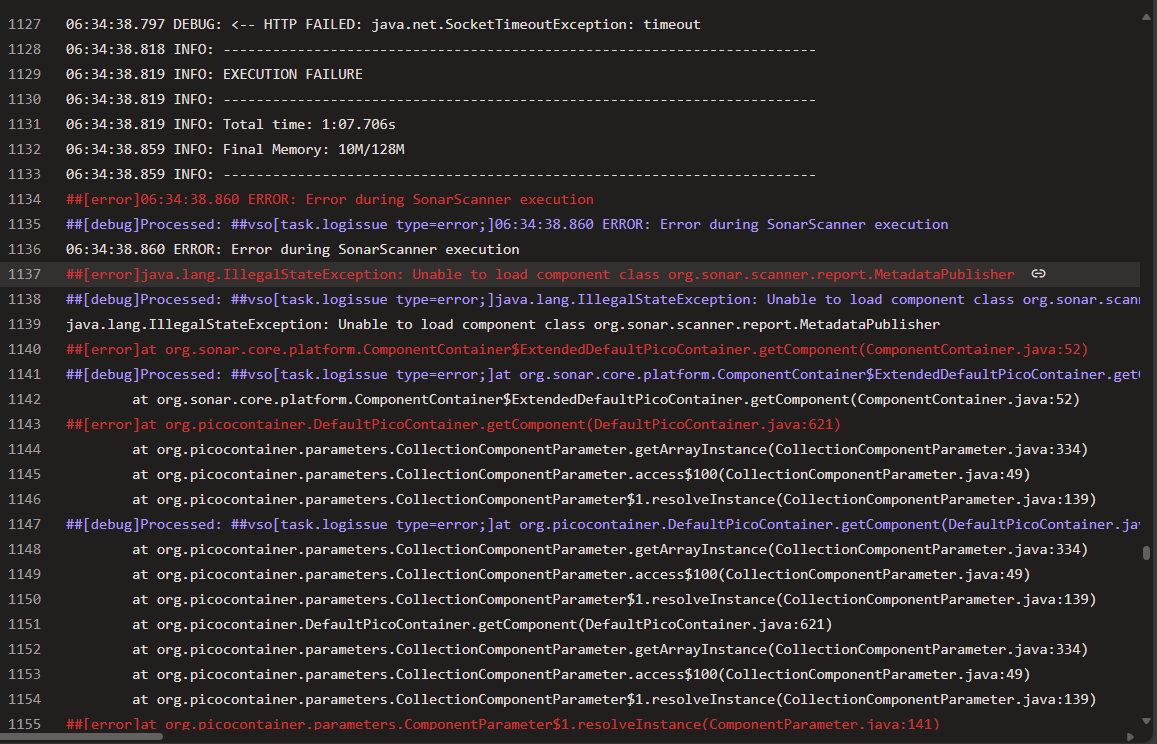
When we try to perform analysis using SonarCloudAnalyze@2 and SonarCloudAnalyze@3, we face this issue:

##[error]06:29:01.091 ERROR: Error during SonarScanner execution

##[debug]Processed: ##vso[task.logissue type=error;]06:29:01.091 ERROR: Error during SonarScanner execution

06:29:01.091 ERROR: Error during SonarScanner execution

06:29:01.091 INFO: ------------------------------------------------------------------------

##[error]java.lang.IllegalStateException: Unable to load component class org.sonar.scanner.report.MetadataPublisher

##[debug]Processed: ##vso[task.logissue type=error;]java.lang.IllegalStateException: Unable to load component class org.sonar.scanner.report.MetadataPublisher

java.lang.IllegalStateException: Unable to load component class org.sonar.scanner.report.MetadataPublisher

##[error]at org.sonar.core.platform.ComponentContainer$ExtendedDefaultPicoContainer.getComponent(ComponentContainer.java:52)

##[debug]Processed: ##vso[task.logissue type=error;]at org.sonar.core.platform.ComponentContainer$ExtendedDefaultPicoContainer.getComponent(ComponentContainer.java:52)

at org.sonar.core.platform.ComponentContainer$ExtendedDefaultPicoContainer.getComponent(ComponentContainer.java:52) 

##[error]at org.picocontainer.DefaultPicoContainer.getComponent(DefaultPicoContainer.java:621)

at org.picocontainer.parameters.CollectionComponentParameter.getArrayInstance(CollectionComponentParameter.java:334) 

##[debug]Processed: ##vso[task.logissue type=error;]at org.picocontainer.DefaultPicoContainer.getComponent(DefaultPicoContainer.java:621)

at org.picocontainer.parameters.CollectionComponentParameter.getArrayInstance(CollectionComponentParameter.java:334) 

at org.picocontainer.DefaultPicoContainer.getComponent(DefaultPicoContainer.java:621) 

at org.picocontainer.parameters.CollectionComponentParameter.getArrayInstance(CollectionComponentParameter.java:334) 

##[error]at org.picocontainer.parameters.CollectionComponentParameter.access$100(CollectionComponentParameter.java:49)

at org.picocontainer.parameters.CollectionComponentParameter$1.resolveInstance(CollectionComponentParameter.java:139) 

at org.picocontainer.parameters.ComponentParameter$1.resolveInstance(ComponentParameter.java:141) 

##[debug]Processed: ##vso[task.logissue type=error;]at org.picocontainer.parameters.CollectionComponentParameter.access$100(CollectionComponentParameter.java:49)

at org.picocontainer.parameters.CollectionComponentParameter$1.resolveInstance(CollectionComponentParameter.java:139) 

at org.picocontainer.parameters.ComponentParameter$1.resolveInstance(ComponentParameter.java:141) 

at org.picocontainer.parameters.CollectionComponentParameter.access$100(CollectionComponentParameter.java:49) 

at org.picocontainer.parameters.CollectionComponentParameter$1.resolveInstance(CollectionComponentParameter.java:139) 

at org.picocontainer.parameters.ComponentParameter$1.resolveInstance(ComponentParameter.java:141)

We are seeing this as well, we are observing various different sonarcloud.io api timeouts. Below are some example logs. Is SonarQube Cloud API having some issues?

04:40:26.336 DEBUG: → POST https://api.sonarcloud.io/analysis/analyses (100-byte body)
04:41:26.389 DEBUG: ← HTTP FAILED: java.net.SocketTimeoutException: timeout

More timeout errors:

java.lang.IllegalStateException: Call to URL [https://api.sonarcloud.io/analysis/jres?os=windows&arch=amd64] failed 

	at org.sonarsource.scanner.lib.internal.http.ScannerHttpClient.callUrl(ScannerHttpClient.java:159) 

	at org.sonarsource.scanner.lib.internal.http.ScannerHttpClient.callApi(ScannerHttpClient.java:126) 

	at org.sonarsource.scanner.lib.internal.http.ScannerHttpClient.callRestApi(ScannerHttpClient.java:104) 

	at org.sonarsource.scanner.lib.internal.JavaRunnerFactory.getJreMetadata(JavaRunnerFactory.java:159) 

	at org.sonarsource.scanner.lib.internal.JavaRunnerFactory.getJreFromServer(JavaRunnerFactory.java:138) 

	at org.sonarsource.scanner.lib.internal.JavaRunnerFactory.createRunner(JavaRunnerFactory.java:85) 

	at org.sonarsource.scanner.lib.internal.ScannerEngineLauncherFactory.createLauncher(ScannerEngineLauncherFactory.java:53) 

	at org.sonarsource.scanner.lib.ScannerEngineBootstrapper.bootstrap(ScannerEngineBootstrapper.java:123) 

	at org.sonarsource.scanner.cli.Main.analyze(Main.java:75) 

	at org.sonarsource.scanner.cli.Main.main(Main.java:63) 

Caused by: java.net.SocketTimeoutException: timeout

Hey folks.

I’m not aware of any ongoing issues, but I’ve reached out to the team to check if there’s a broader issue.

Does this happen on every analysis, or is it intermittent?

Hi Colin,

We are getting significantly more failures than requests. Interestingly we are mainly seeing this all of a sudden on our Windows Hosts doing the scans. Our linux hosts seem to not be timing out. It is not our network or machines as we have VMs running in the cloud, and on premise that are experiencing the same issue.

I wonder if there is some specific endpoint for windows? I see this is the stacktrace:
java.lang.IllegalStateException: Call to URL [https://api.sonarcloud.io/analysis/jres?os=windows&arch=amd64\\] failed

This just started out of nowhere around 12:30 AM EST this morning. We’ve been running these scans without issue for quite some time.

Thanks!

Are you also running in Azure Devops like @chaithanya ?

Yes we are running in azure devops

EDIT for below comment (it wont let me do another post as apparently 3 is max for new users per thread)

————

I think it is related, we also see intermittent timeout errors when downloading plugins on our windows agents

##[error]java.lang.IllegalStateException: Fail to download plugin [iac] into C:\Users\azdevops\.sonar\_tmp\fileCache7784127239321394354.tmp
##[debug]Processed: ##vso[task.logissue type=error;]java.lang.IllegalStateException: Fail to download plugin [iac] into C:\Users\azdevops\.sonar\_tmp\fileCache7784127239321394354.tmp
java.lang.IllegalStateException: Fail to download plugin [iac] into C:\Users\azdevops\.sonar\_tmp\fileCache7784127239321394354.tmp
##[error]at org.sonar.scanner.bootstrap.PluginFiles.downloadBinaryTo(PluginFiles.java:108)
##[debug]Processed: ##vso[task.logissue type=error;]at org.sonar.scanner.bootstrap.PluginFiles.downloadBinaryTo(PluginFiles.java:108)
	at org.sonar.scanner.bootstrap.PluginFiles.downloadBinaryTo(PluginFiles.java:108)

That is after doing the get to:
17:34:22.512 DEBUG: → GET https://scanner.sonarcloud.io/plugins/iac/versions/3c1d6b597e1574c8810f22b0d4abd9fd.jar

Hi,

I am not sure if this is related, but ever since yesterday afternoon we’ve been getting timeouts when the Azure Sonarcloud Analysis tries to download plugins, such as this one:

https://scanner.sonarcloud.io/plugins/iac/versions/3c1d6b597e1574c8810f22b0d4abd9fd.jar

The Analysis is able to download some of the plugins, so it doesn’t seems to be a network issue. Currently, the plugin where it fail the most is “iac“, but they have been some case where it is “javascript“ that is failing.

We are also running the Analysis on AzureDevOPS, using Windows agents.

Thanks everyone. It’s super interesting that you are all facing this issue on Azure DevOps, and I’ve sounded some alarm bells.

2 Likes

Hi Colin,
I wanted to check if there’s any update on the plugin download and Windows timeout issue in Azure DevOps agents? We’re still experiencing the problem on our side.

Hey all.

Thanks for the reports. Based on the patterns we’re seeing, this appears to be a network/routing issue affecting specific geographic regions or network paths rather than a SonarQube Cloud platform issue.

To help us diagnose this, could you temporarily modify your Azure DevOps pipeline to collect some diagnostic information? Here’s what would be helpful:

Add a debug script task before your SonarCloud task:

# For Windows agents
- powershell: |
    Write-Host "=== Network Diagnostics ==="
    Write-Host "Timestamp: $(Get-Date)"
    Write-Host "Agent IP:"
    (Invoke-WebRequest -Uri "https://api.ipify.org" -UseBasicParsing).Content
    Write-Host ""
    Write-Host "DNS Resolution:"
    nslookup api.sonarcloud.io
    Write-Host ""
    Write-Host "Traceroute to SonarCloud API:"
    tracert -h 20 api.sonarcloud.io
  displayName: 'Network Diagnostics (Windows)'
  condition: eq(variables['Agent.OS'], 'Windows_NT')
  continueOnError: true

If the pipeline fails with the timeout, please share:

  1. The complete output from this diagnostic task
  2. Your approximate geographic location or Azure region where the agent is running
  3. Whether you’re using Microsoft-hosted or self-hosted agents

I’m also happy to open a private message with any of you to share the results of these diagnostics.

1 Like

Hi I am also facing some sonar cloud api issues.

I have run the diagnotics script, and I am getting Timeout on every connection attempts.

Could you open a private message with me so I can share the logs?

I have tried the diagnostics and did see the timeout on every request, @Colin can you please open a private message, I will share the diagnostic logs.

Hi Colin , I did ran the diagnostics as suggested above and did see timeouts. Please open a private message or share the findings / progress here to keep us in loop.

thanks!

Hello @Colin , how can i send you logs? Our company facing the issue.

Hi Colin , Please share if you have any update on the timeout issue.

Hi All,

We are trying to localize the source of the issue. The given endpoints seems to be available for most customers and we could not correlate a change on our side which could indicate failures. We are in connection with our cloud provider to try to find if any change on their side or network routing complication could result outage, also we are working on trying to repro the issue.

To find network level issues are hard as we maybe in a different region and the network path even to the same endpoint/ip address will differ.

What we can see so far from the traceroutes provided that the api.sonarcloud.io is resolved successfully so a network path found.

I may follow up specific question as it would be helpful for us to be able to get more information closer to the source of the issue in your pipelines.

Thanks
Csaba

What we noticed is that we are primarily experiencing this issue in the Canada Central region. We spawned new VMs in South Central US region to test and the reliability was significantly better.

The interesting thing is that our self hosted VMs are in Toronto Canada and our Azure VMs are in Canada Central (so it seems to be related to this region at least for us)

thanks @mjesperson that is super useful if the other errors are similar it could point us to regional failures which is our first suspect sofar.

Could you please execute verbose Invoke-WebRequest in the and send the results to us privately?
URL: https://api.sonarcloud.io/analysis/jres?os=windows&arch=amd64’ using header: ‘Authorization: Bearer $(SONAR_TOKEN)’

And source IP-s could help us to check more on our side.

Did you maybe reach out to Azure if they found something on their sides?

Thanks
Csaba

Sure, not all of our VMs are in azure, we have self hosted ones running on our own server that we have in our own Data Center (Also in Toronto Canada) separate from Azure, so I don’t think it is an azure specific issue.

Interestingly I get no errors when manually running these Invoke-WebRequests in Powershell on the same VMs that failed to hit the URLs per the errors shown.

https://api.sonarcloud.io/analysis/jres?os=windows&arch=amd64 GET worked without issue

https://sonarcloud.io/batch/index GET also was successful (I saw this fail as well in one of our tasks)

EDIT

I can share an example source IP where this failed when running the sonarcloud scan task, but was successful when I did the request in powershell