We are using SonarQube Developer Edition 9.8 (build 63668)
It is deployed via Docker, hosted in Azure VM
We are enforcing quality gate on “New Code” via the built-in Sonar Way quality gate
We follow the git flow branching strategy, and have set up Jenkins pipeline jobs capable of building/scanning each branch
Scans are mandatory for master, hotfix, and developer branches, but optional for other branches
Hello, Sonar Community experts!
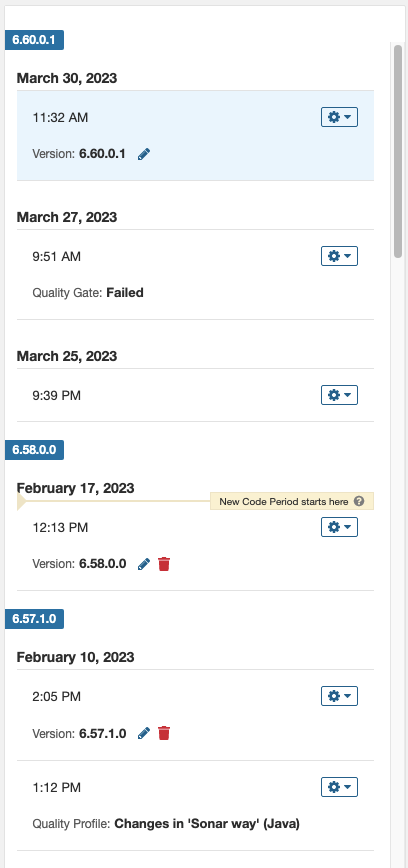
We are observing a strange behavior in our SonarQube instance, as illustrated by the image below. All three builds are against the same commit on master branch, and the SonarQube analysis is done using the “Previous Version” as the criteria for new code detection.
However, as illustrated, build #33 passed quality gate, but subsequent builds failed quality gate. I would expect repeat analysis of the exact same code to yield the same outcome. Can you help me understand why SonarQube is not behaving this way?
What are you passing in to sonar.projectVersion? If it’s a build string or some other value that changes with each analysis, then you’ve essentially set your new code period to “previous analysis”. However, in that case, I would expect subsequent analyses to pass.
You’ve shown only Quality Gate status. What are the concrete changes in the Quality Gate? I.e. which conditions pass/fail and with what values?
Thank you for confirming that subsequent scans should also pass.
We are not passing anything via sonar.projectVersion scanning parameter for these scans. What we observe to be happening is that the sonar:sonar Maven task is automatically picking the version number in the pom.xml file. However, in this case, the version number and code have not changed at all.
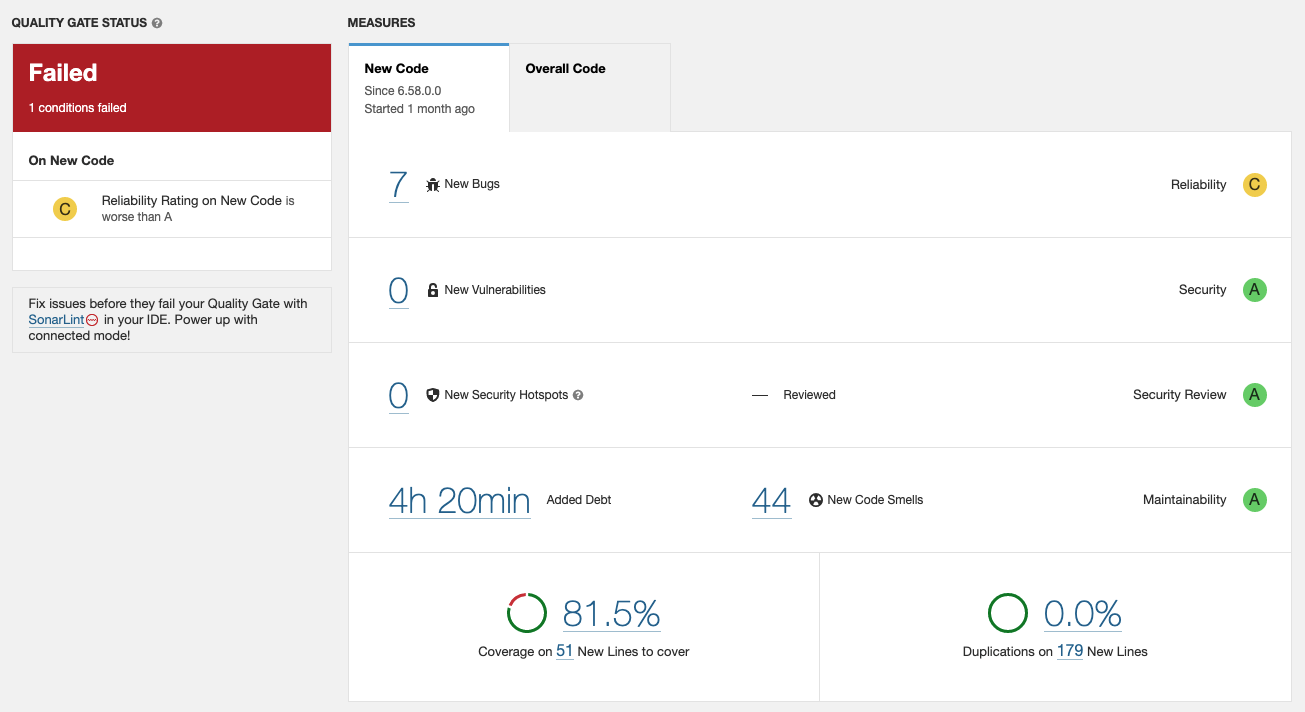
The reported failure is on bugs found, as shown in the screenshot below.
On 25 March you incremented your version number to 6.60.0.1 and analyzed commit f697348 → QG
On 27 March, 9:48a you reanalyzed the same commit with the same version number → QG
I suspect the crux here is what’s considered new code in the first analysis with a new sonar.projectVersion value.
Do you happen to still have access to the log from the 25 March analysis? And if so, would you copy/paste the log text here?
The analysis / scanner log is what’s output from the analysis command. Hopefully, the log you provide - redacted as necessary - will include that command as well.
I have attached the portion of the log relevant to running mvn sonar:sonar from the March 25th analysis with some redacting of DNS information for the machines hosting Artifactory and SonarQube.
I’m wondering if your pipeline edits files in the workspace. Because I find this odd:
[Report about progress of file indexation] INFO org.sonarsource.scanner.maven.SonarQubeMojo - 87 files indexed
...
[main] INFO org.sonarsource.scanner.maven.SonarQubeMojo - Using ECJ batch to parse 19 Main java source files with batch size 429 KB.
...
[main] INFO org.sonarsource.scanner.maven.SonarQubeMojo - Using ECJ batch to parse 1 Test java source files with batch size 429 KB.
...
[Report about progress of XML Analyzer] INFO org.sonarsource.scanner.maven.SonarQubeMojo - 1 source file to be analyzed
[Report about progress of XML Analyzer] INFO org.sonarsource.scanner.maven.SonarQubeMojo - 1/1 source file has been analyzed
...
[Progress of the text analysis] INFO org.sonarsource.scanner.maven.SonarQubeMojo - 21 source files to be analyzed
[Progress of the text analysis] INFO org.sonarsource.scanner.maven.SonarQubeMojo - 21/21 source files have been analyzed
...
[&etc]
So we see that 87 files are indexed and then we see them being analyzed in batches by language. And then…
[main] INFO org.sonarsource.scanner.maven.SonarQubeMojo - SCM Publisher 11 source files to be analyzed
The SCM publisher only thinks 11 files are relevant. Why is this important?
You’re looking at conditions on new code in your Quality Gate
It’s SCM data that’s used to determine what’s new and what’s not.
If the first analysis of the new version wasn’t able to collect SCM data on the majority of the files, it could explain why the issues that eventually caused the QG to fail weren’t initially recognized as new.
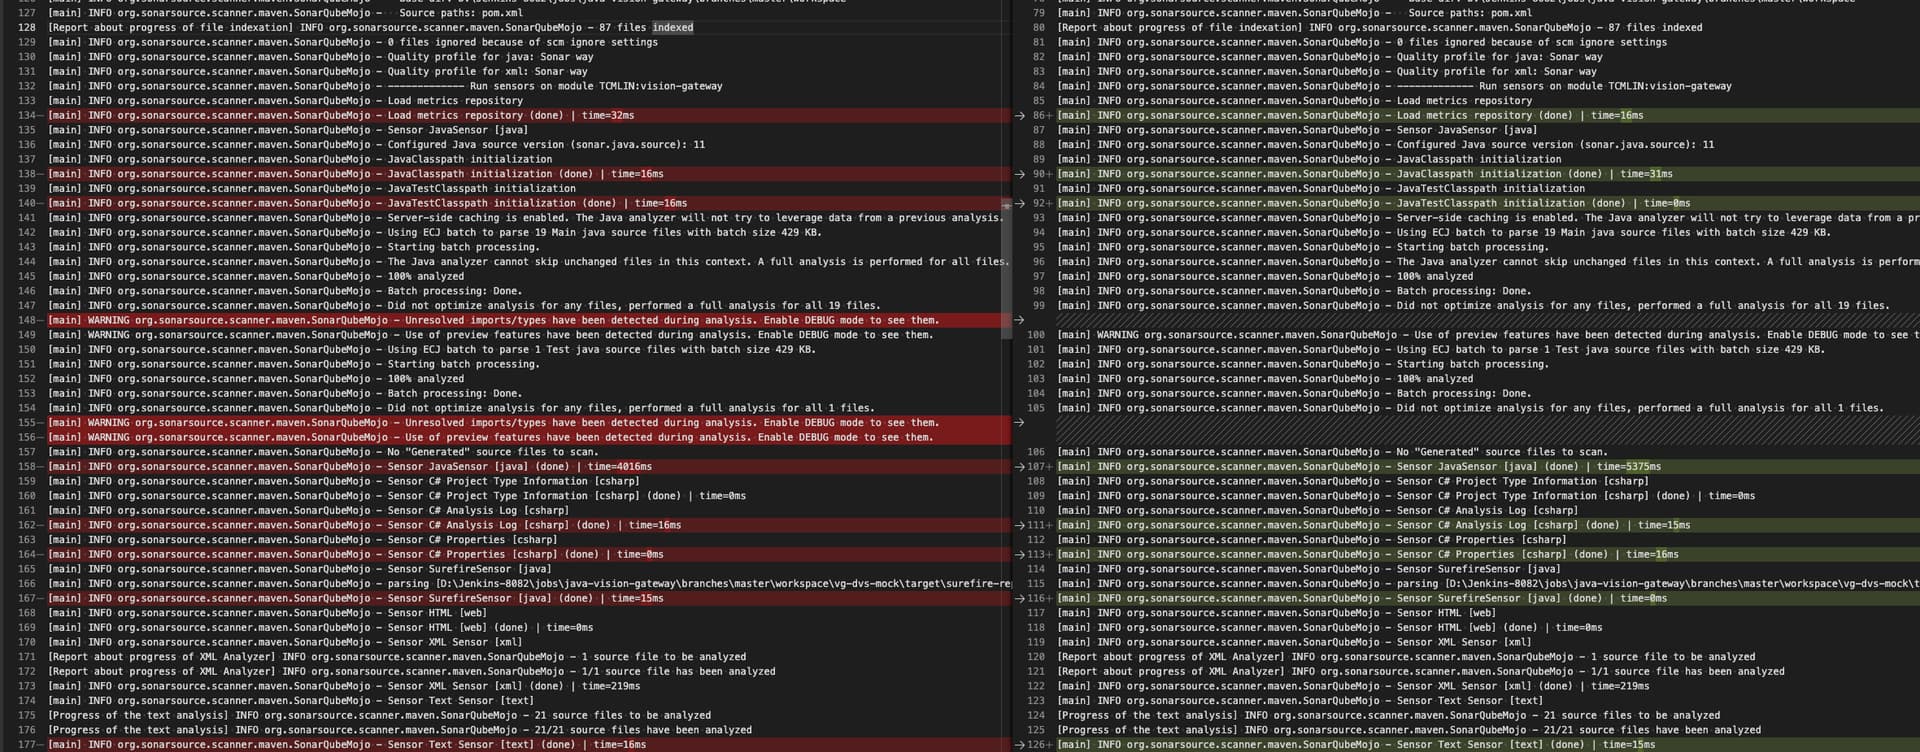
I compared the logs for the different builds. On the left is the build that passed quality gate, and on the right is a build that failed quality gate. Below are screenshots of what I see.
How come the successful scan picked up the 11 files to be analyzed, but subsequent failures did not?
Also, I double checked by remote into the build sever and ran git commands on the workspace. As far as I can tell, no files were modified by the pipeline.
Lastly, the right-hand side are actually logs from a scan I performed, and I ensured the workspace is wiped out to force a new clone.
Thanks for the logs. They show that this is not the same analysis twice.
First we have these warnings that appear only in one file:
[main] WARNING org.sonarsource.scanner.maven.SonarQubeMojo - Unresolved imports/types have been detected during analysis. Enable DEBUG mode to see them.
[main] WARNING org.sonarsource.scanner.maven.SonarQubeMojo - Use of preview features have been detected during analysis. Enable DEBUG mode to see them.
...
[main] WARNING org.sonarsource.scanner.maven.SonarQubeMojo - Unresolved imports/types have been detected during analysis. Enable DEBUG mode to see them.
[main] WARNING org.sonarsource.scanner.maven.SonarQubeMojo - Use of preview features have been detected during analysis. Enable DEBUG mode to see them.
And then we have differences in the number of type definitions
Read 316 type definitions
in the warnings file vs
Read 439 type definitions
And in the number of UCFGs:
Retained UCFGs : 18
in the warnings file vs
Retained UCFGs : 34
These things tell me there are definitely different inputs to the two analyses.