- ALM used: Azure DevOps
- CI system used: Azure DevOps
- Scanner command used when applicable: Not applicable
- Languages of the repository: C# and C++
- Only if the SonarCloud project is public, the URL: Not applicable, it is a private project
- Error observed:
We configured an Azure DevOps pipeline to build our application and we are using the extension for SonarQube Cloud to run the scanner and publish the results in the SonarQube cloud. In the prepare analysis configuration step, we are setting for the code coverage two properties for the scanner (sonar.cs.vscoveragexml.reportsPaths and sonar.coverageReportPaths). For the first one, we set the path to the output of DotNet Coverage extension (which returns the coverage of the C# code) while for the second one, we set the path to the output generated by ReportGenerator in SonarQube format (which returns the coverage of the C++ code). When the coverage files are generated, we use the Publish code coverage results step providing the same output file from DotNet Coverage and other output file generated by ReportGenerator in Cobertura format. After this, the run code analysis step is executed and finally, the publish quality gate result step is executed. Even though the list of covered files seems fine, and the covered lines in each file are consistent with the indicated by ReportGenerator, in the Code Coverage tab of the pipeline run, the number of coverable lines indicated by ReportGenerator is significantly different from the lines to cover metric in the SonarQube cloud (93K vs 22K).
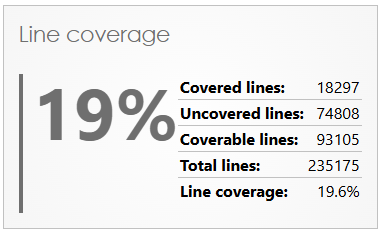

As you can also see on the shared captures there are also inconsistencies in the line coverage percentages: 19.6% in ReportGenerator vs 16.7% in SonarQube cloud. Do you have any idea why this might be happening and how to avoid it? We would appreciate your support.
- Steps to reproduce: See above
- Potential workaround: Not applicable