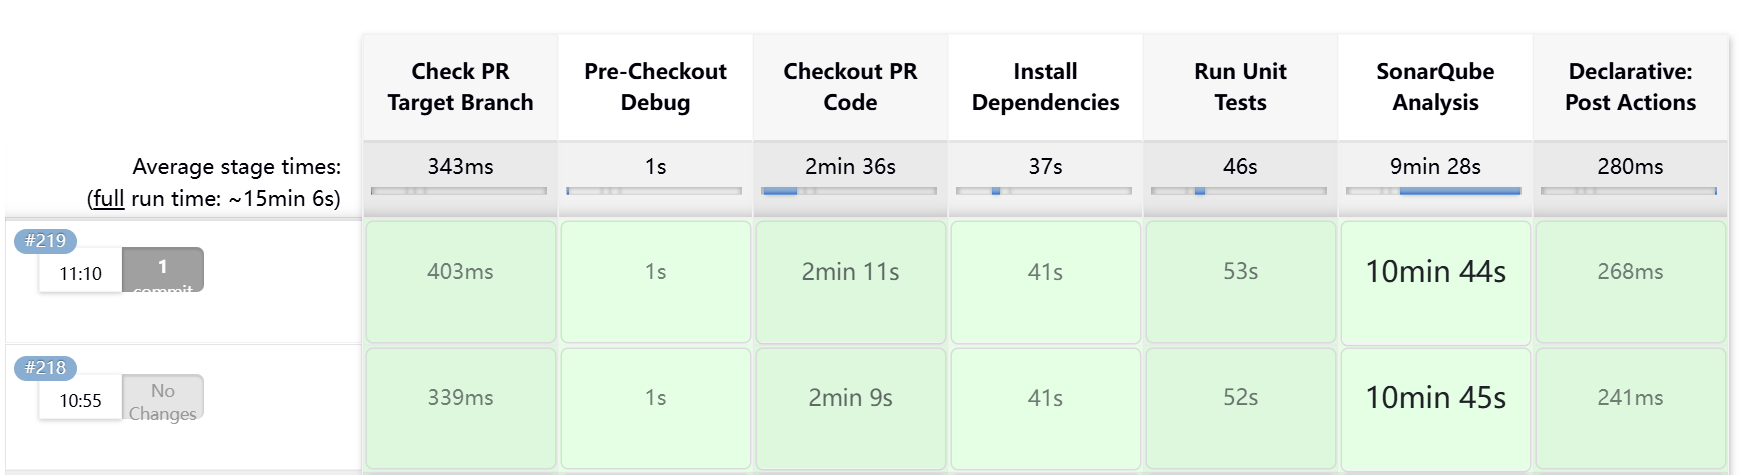
Our Jenkins pipeline for pull request analysis is taking around 15 minutes to complete. The “SonarQube Analysis” stage alone consumes over 10 minutes, which is significantly slowing down our development feedback loop. We are looking for advice on how to optimize this.
Here is the required information about our setup:
Which versions are you using?
SonarQube Server: [ v9.9.7 ]
Scanner: We use sonar-scanner invoked via the Jenkins SonarQube Scanner plugin. The scanner itself runs in a nodejs: 18.20.3 environment as configured in our Jenkinsfile.
How is SonarQube deployed?
Our SonarQube server is deployed using [Docker].
Our Jenkins agents are standard nodes.
What are you trying to achieve?
We want to dramatically reduce the SonarQube analysis time for pull requests, ideally from the current 15+ minutes down to under 10 minutes, to provide faster feedback to our developers.
What have you tried so far to achieve this?
We have configured sonar.exclusions to ignore irrelevant files and directories like src/assets and .less files.
We are using the correct parameters for pull request analysis (sonar.pullrequest.key, sonar.pullrequest.branch, sonar.pullrequest.base, etc.).
We are ensuring our main target branch (dev) is analyzed regularly to provide a fresh baseline for the differential analysis.
Below is the relevant stage from our Jenkinsfile that executes the scan.
Oh, and I also tried using a git shallow clone to speed up the “Checkout PR Code” stage. However, this caused SonarQube to report code smells on files that were not part of my PR’s changes. We had to disable it. The shallow clone configuration I used was:
+ /path/to/sonar-scanner/bin/sonar-scanner -Dsonar.projectKey=[MY_PROJECT_KEY] -Dsonar.sources=src/,views/,packages/ '-Dsonar.exclusions=src/assets/**/*,**/*.json,**/*.less' -Dsonar.sourceEncoding=UTF-8 '-Dsonar.coverage.exclusions=**/*' -Dsonar.pullrequest.key=[PR_ID] -Dsonar.pullrequest.branch=[MY_FEATURE_BRANCH] -Dsonar.pullrequest.base=dev -Dsonar.pullrequest.provider=bitbucketserver -Dsonar.pullrequest.bitbucketserver.project=[MY_PROJECT] -Dsonar.pullrequest.bitbucketserver.repository=[MY_REPO] -Dsonar.analysis.commit.id=[COMMIT_HASH] -Dsonar.analysis.pullrequest.key=[PR_ID] -Dsonar.analysis.pullrequest.bitbucketserver.project=[MY_PROJECT] -Dsonar.analysis.pullrequest.bitbucketserver.repository=[MY_REPO]
11:13:58.195 INFO  Scanner configuration file: /path/to/sonar-scanner/conf/sonar-scanner.properties
11:13:58.199 INFO  Project root configuration file: NONE
11:13:58.220 INFO  SonarScanner CLI 7.0.2.4839
11:13:58.222 INFO  Java 17.0.14 Red Hat, Inc. (64-bit)
11:13:58.223 INFO  Linux 5.14.0-503.26.1.el9_5.x86_64 amd64
11:13:58.261 INFO  User cache: /home/jenkins/.sonar/cache
11:13:59.289 INFO  Communicating with SonarQube Server 9.9.7.96285
11:13:59.814 INFO  Load global settings
11:13:59.960 INFO  Load global settings (done) | time=147ms
11:13:59.964 INFO  Server id: [REDACTED_SERVER_ID]
11:13:59.969 INFO  User cache: /home/jenkins/.sonar/cache
11:13:59.973 INFO  Load/download plugins
11:13:59.974 INFO  Load plugins index
11:14:00.025 INFO  Load plugins index (done) | time=51ms
11:14:00.135 INFO  Load/download plugins (done) | time=162ms
11:14:00.745 INFO  Process project properties
11:14:00.758 INFO  Process project properties (done) | time=12ms
11:14:00.762 INFO  Execute project builders
11:14:00.765 INFO  Execute project builders (done) | time=3ms
11:14:00.768 INFO  Project key: [MY_PROJECT_KEY]
11:14:00.768 INFO  Base dir: /path/to/workspace/
11:14:00.769 INFO  Working dir: /path/to/workspace/.scannerwork
11:14:00.780 INFO  Load project settings for component key: '[MY_PROJECT_KEY]'
11:14:00.818 INFO  Load project settings for component key: '[MY_PROJECT_KEY]' (done) | time=38ms
11:14:00.919 INFO  Load project branches
11:14:00.945 INFO  Load project branches (done) | time=26ms
11:14:00.945 INFO  Load branch configuration
11:14:00.948 INFO  Load branch configuration (done) | time=3ms
11:14:01.006 INFO  Auto-configuring with CI 'Jenkins'
11:14:01.009 INFO  Load quality profiles
11:14:01.080 INFO  Load quality profiles (done) | time=71ms
11:14:01.085 INFO  Load active rules
11:14:03.933 INFO  Load active rules (done) | time=2848ms
11:14:03.939 INFO  Load analysis cache
11:14:03.951 INFO  Load analysis cache (404) | time=12ms
11:14:03.985 INFO  Pull request [PR_ID] for merge into dev from [MY_FEATURE_BRANCH]
11:14:04.001 INFO  Load project repositories
11:14:04.196 INFO  Load project repositories (done) | time=195ms
11:14:04.199 INFO  SCM collecting changed files in the branch
11:14:04.367 INFO  Merge base sha1: [REDACTED_MERGE_BASE_SHA]
11:14:04.409 INFO  SCM collecting changed files in the branch (done) | time=210ms
11:14:04.440 INFO  Indexing files...
11:14:04.440 INFO  Project configuration:
11:14:04.441 INFO    Excluded sources: src/assets/**/*, **/*.json, **/*.less
11:14:04.441 INFO    Excluded sources for coverage: **/*
11:14:09.413 INFO  Some of the project files were automatically excluded because they looked like generated code. Enable debug logging to see which files were excluded. You can disable bundle detection by setting sonar.javascript.detectBundles=false
11:14:09.578 INFO  6835 files indexed
11:14:09.578 INFO  2292 files ignored because of inclusion/exclusion patterns
11:14:09.578 INFO  0 files ignored because of scm ignore settings
11:14:09.580 INFO  Quality profile for js: Sonar way
11:14:09.580 INFO  Quality profile for ts: Jdy FE Sonar way
11:14:09.580 INFO  ------------- Run sensors on module [MY_PROJECT_KEY]
11:14:09.677 INFO  Load metrics repository
11:14:09.705 INFO  Load metrics repository (done) | time=28ms
11:14:11.047 INFO  Sensor JaCoCo XML Report Importer [jacoco]
11:14:11.049 INFO  No report imported, no coverage information will be imported by JaCoCo XML Report Importer
11:14:11.049 INFO  Sensor JaCoCo XML Report Importer [jacoco] (done) | time=3ms
11:14:11.049 INFO  Sensor JavaScript analysis [javascript]
11:14:15.471 INFO  15 source files to be analyzed
11:14:26.225 INFO  15/15 source files have been analyzed
11:14:26.226 INFO  Hit the cache for 0 out of 15
11:14:26.228 INFO  Miss the cache for 15 out of 15: FILE_CHANGED [15/15]
11:14:26.228 INFO  Sensor JavaScript analysis [javascript] (done) | time=15179ms
11:14:26.228 INFO  Sensor TypeScript analysis [javascript]
11:14:26.438 INFO  Found 1 tsconfig.json file(s): [/path/to/workspace/tsconfig.json]
11:14:26.439 INFO  Creating TypeScript program
11:14:26.439 INFO  6637 source files to be analyzed
11:14:26.439 INFO  TypeScript configuration file /path/to/workspace/tsconfig.json
11:14:37.812 INFO  Creating TypeScript program (done) | time=11373ms
11:14:37.812 INFO  Starting analysis with current program
... (long list of files being analyzed, truncated for brevity) ...
11:24:20.425 INFO  Analyzed 6637 file(s) with current program
11:24:20.446 INFO  6637/6637 source files have been analyzed
11:24:20.446 INFO  Hit the cache for 0 out of 6637
11:24:20.447 INFO  Miss the cache for 6637 out of 6637: FILE_CHANGED [6637/6637]
11:24:20.447 INFO  Sensor TypeScript analysis [javascript] (done) | time=594219ms
11:24:20.447 INFO  Sensor CSS Rules [javascript]
11:24:20.456 INFO  No CSS, PHP, HTML or VueJS files are found in the project. CSS analysis is skipped.
11:24:20.456 INFO  Sensor CSS Rules [javascript] (done) | time=9ms
... (other non-essential sensors) ...
11:24:20.758 INFO  ------------- Run sensors on project
11:24:20.830 INFO  Sensor Zero Coverage Sensor
11:24:20.831 INFO  Sensor Zero Coverage Sensor (done) | time=1ms
11:24:20.844 INFO  SCM Publisher SCM provider for this project is: git
11:24:20.846 INFO  SCM Publisher 14 source files to be analyzed
11:24:21.450 INFO  SCM Publisher 14/14 source files have been analyzed (done) | time=603ms
11:24:22.152 INFO  CPD Executor 2492 files had no CPD blocks
11:24:22.153 INFO  CPD Executor Calculating CPD for 4160 files
... (duplication warnings) ...
11:24:24.308 INFO  CPD Executor CPD calculation finished (done) | time=2155ms
11:24:24.762 INFO  SCM writing changed lines
11:24:24.796 INFO  Merge base sha1: [REDACTED_MERGE_BASE_SHA]
11:24:24.925 INFO  SCM writing changed lines (done) | time=163ms
11:24:25.112 INFO  Analysis report generated in 615ms, dir size=6.7 MB
11:24:29.151 INFO  Analysis report compressed in 4038ms, zip size=5.3 MB
11:24:29.725 INFO  Analysis report uploaded in 574ms
11:24:29.729 INFO  ANALYSIS SUCCESSFUL, you can find the results at: https://[SONARQUBE_URL]/dashboard?id=[MY_PROJECT_KEY]&pullRequest=[PR_ID]
11:24:29.729 INFO  Note that you will be able to access the updated dashboard once the server has processed the submitted analysis report
11:24:29.729 INFO  More about the report processing at https://[SONARQUBE_URL]/api/ce/task?id=[REDACTED_TASK_ID]
11:24:37.327 INFO  Analysis total time: 10:37.058 s
11:24:37.330 INFO  EXECUTION SUCCESS
11:24:37.330 INFO  Total time: 10:39.176s
Your version is past EOL. You should upgrade to either the latest version or the current LTA (long-term active version) at your earliest convenience. Your upgrade path is:
If you have questions about upgrading, feel free to open a new thread for that here.
If your error persists after upgrade, please come back to us. In particular since this is a PR-analysis context, I’ll be interested to know if after upgrade it’s still analyzing all 6637 TypeScript files for PRs.