INFO: No report imported, no coverage information will be imported by JaCoCo XML Report Importer
INFO: Sensor JaCoCo XML Report Importer [jacoco] (done) | time=14ms
INFO: Sensor JavaScript analysis [javascript]
INFO: 390 source files to be analyzed
INFO: 1/390 file analyzed, current file: /builds/Raghul01/backend/models/meta_content_details.js
INFO: 1/390 file analyzed, current file: /builds/Raghul01/backend/models/meta_content_details.js
INFO: 1/390 file analyzed, current file: /builds/Raghul01/backend/models/meta_content_details.js
ERROR:
ERROR: <--- Last few GCs --->
ERROR:
ERROR: [56:0x7ffade215220]
    38487 ms: Mark-sweep (reduce) 1840.1 (1870.1) -> 1839.1 (1870.6) MB, 933.8 / 0.0 ms  (+ 612.7 ms in 93 steps since start of marking, biggest step 17.3 ms, walltime since start of marking 1853 ms) (average mu = 0.352, current mu = 0.[56:0x7ffade215220]
    40916 ms: Mark-sweep (reduce) 1840.2 (1870.6) -> 1839.7 (1871.4) MB, 2411.3 / 0.0 ms  (average mu = 0.185, current mu = 0.007) allocation failure; scavenge might not succeed
ERROR:
ERROR:
ERROR: <--- JS stacktrace --->
ERROR:
ERROR: FATAL ERROR: Reached heap limit Allocation failed - JavaScript heap out of memory
ERROR: eslint-bridge Node.js process is unresponsive. This is most likely caused by process running out of memory. Consider setting sonar.javascript.node.maxspace to higher value (e.g. 4096).
ERROR: Failure during analysis, Node.js command to start eslint-bridge was: node /builds/Raghul01/backend/.scannerwork/.sonartmp/eslint-bridge-bundle/package/bin/server 43517 127.0.0.1 /builds/Raghul01/backend/.scannerwork true false /builds/Raghul01/backend/.scannerwork/.sonartmp/eslint-bridge-bundle/package/custom-rules2104715126157411180/package
java.lang.IllegalStateException: eslint-bridge is unresponsive
	at org.sonar.plugins.javascript.eslint.EslintBridgeServerImpl.request(EslintBridgeServerImpl.java:306)
	at org.sonar.plugins.javascript.eslint.EslintBridgeServerImpl.analyzeJavaScript(EslintBridgeServerImpl.java:263)
	at org.sonar.plugins.javascript.eslint.JavaScriptEslintBasedSensor.analyze(JavaScriptEslintBasedSensor.java:119)
	at org.sonar.plugins.javascript.eslint.JavaScriptEslintBasedSensor.runEslintAnalysis(JavaScriptEslintBasedSensor.java:97)
	at org.sonar.plugins.javascript.eslint.JavaScriptEslintBasedSensor.analyzeFiles(JavaScriptEslintBasedSensor.java:74)
	at org.sonar.plugins.javascript.eslint.AbstractEslintSensor.execute(AbstractEslintSensor.java:69)
sonar-scanner
INFO: Scanner configuration file: /opt/sonar-scanner/conf/sonar-scanner.properties
INFO: Project root configuration file: /builds/Raghul01/backend/sonar-project.properties
INFO: SonarScanner 4.8.0.2856
INFO: Java 11.0.17 Alpine (64-bit)
INFO: Linux 5.4.109+ amd64
INFO: SONAR_SCANNER_OPTS=-Xmx4096m
INFO: User cache: /builds/Raghul01/backend/.sonar/cache
INFO: Analyzing on SonarQube server 8.0.0.36324
INFO: Default locale: "en_US", source code encoding: "UTF-8" (analysis is platform dependent)
INFO: Load global settings
INFO: Load global settings (done) | time=691ms
INFO: Server id: 1BD809FA-AWHW8ct9-T_TB3XqouNu
INFO: User cache: /builds/Raghul01/backend/.sonar/cache
INFO: Load/download plugins
INFO: Load plugins index
INFO: Load plugins index (done) | time=635ms
INFO: Load/download plugins (done) | time=1055ms
INFO: Loaded core extensions: developer-scanner
INFO: Found an active CI vendor: 'Gitlab CI'
INFO: Load project settings for component key: 'Raghul01_backend'
INFO: Load project settings for component key: 'Raghul01_backend' (done) | time=604ms
INFO: Process project properties
INFO: Execute project builders
INFO: Execute project builders (done) | time=2ms
INFO: Project key: Raghul01_backend
INFO: Base dir: /builds/Raghul01/backend
INFO: Working dir: /builds/Raghul01/backend/.scannerwork
INFO: Load project branches
INFO: Load project branches (done) | time=605ms
INFO: Check ALM binding of project 'Raghul01_backend'
INFO: Detected project binding: BOUND
INFO: Check ALM binding of project 'Raghul01_backend' (done) | time=585ms
INFO: Load project pull requests
INFO: Load project pull requests (done) | time=628ms
INFO: Load branch configuration
INFO: Auto-configuring branch sonar
INFO: Load branch configuration (done) | time=8ms
INFO: Load quality profiles
INFO: Load quality profiles (done) | time=610ms
INFO: Load active rules
INFO: Load active rules (done) | time=5831ms
INFO: Organization key: raghul01
INFO: Branch name: sonar, type: short-lived
INFO: Load project repositories
INFO: Load project repositories (done) | time=821ms
INFO: SCM collecting changed files in the branch
INFO: SCM collecting changed files in the branch (done) | time=368ms
INFO: Indexing files...
INFO: Project configuration:
INFO: Included sources: services/**
INFO: Excluded sources: **/build-wrapper-dump.json, seeders/**, uploads/**, migrations/**, patches/**
INFO: Excluded sources for duplication: seeders/**
INFO: 39 files indexed
INFO: 1026 files ignored because of inclusion/exclusion patterns
INFO: 0 files ignored because of scm ignore settings
INFO: Quality profile for js: Sonar way
INFO: Quality profile for json: Sonar way
INFO: ------------- Run sensors on module Raghul01_backend
INFO: Load metrics repository
INFO: Load metrics repository (done) | time=566ms
INFO: Sensor cache enabled
INFO: Load sensor cache
INFO: Load sensor cache (404) | time=905ms
INFO: Sensor IaC CloudFormation Sensor [iac]
INFO: 0 source files to be analyzed
INFO: 0/0 source files have been analyzed
INFO: Sensor IaC CloudFormation Sensor [iac] (done) | time=34ms
INFO: Sensor IaC Kubernetes Sensor [iac]
INFO: 0 source files to be analyzed
INFO: 0/0 source files have been analyzed
INFO: Sensor IaC Kubernetes Sensor [iac] (done) | time=13ms
INFO: Sensor C# Project Type Information [csharp]
INFO: Sensor C# Project Type Information [csharp] (done) | time=6ms
INFO: Sensor C# Analysis Log [csharp]
INFO: Sensor C# Analysis Log [csharp] (done) | time=27ms
INFO: Sensor C# Properties [csharp]
INFO: Sensor C# Properties [csharp] (done) | time=1ms
INFO: Sensor HTML [web]
INFO: Sensor HTML [web] (done) | time=5ms
INFO: Sensor Text Sensor [text]
INFO: 38 source files to be analyzed
INFO: 38/38 source files have been analyzed
INFO: Sensor Text Sensor [text] (done) | time=88ms
INFO: Sensor VB.NET Project Type Information [vbnet]
INFO: Sensor VB.NET Project Type Information [vbnet] (done) | time=4ms
INFO: Sensor VB.NET Analysis Log [vbnet]
INFO: Sensor VB.NET Analysis Log [vbnet] (done) | time=28ms
INFO: Sensor VB.NET Properties [vbnet]
INFO: Sensor VB.NET Properties [vbnet] (done) | time=1ms
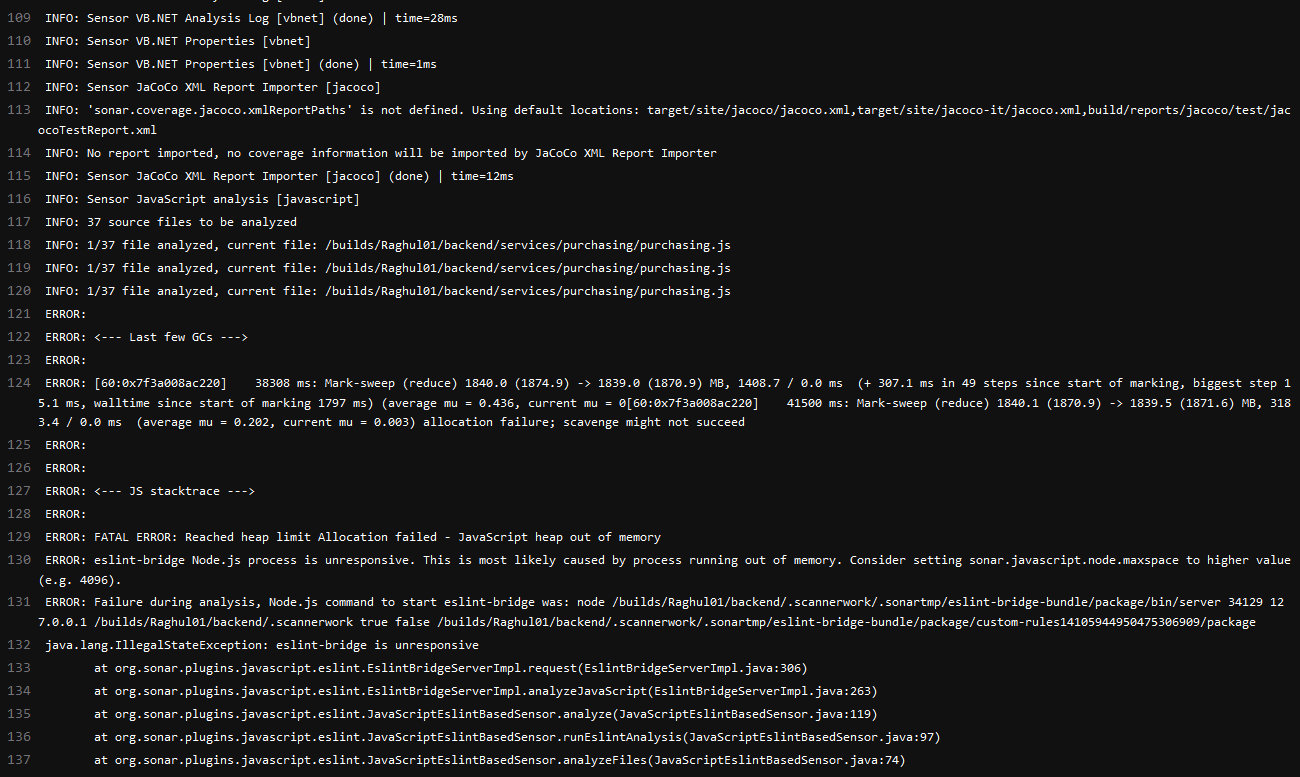
INFO: Sensor JaCoCo XML Report Importer [jacoco]
INFO: 'sonar.coverage.jacoco.xmlReportPaths' is not defined. Using default locations: target/site/jacoco/jacoco.xml,target/site/jacoco-it/jacoco.xml,build/reports/jacoco/test/jacocoTestReport.xml
INFO: No report imported, no coverage information will be imported by JaCoCo XML Report Importer
INFO: Sensor JaCoCo XML Report Importer [jacoco] (done) | time=12ms
INFO: Sensor JavaScript analysis [javascript]
INFO: 37 source files to be analyzed
INFO: 1/37 file analyzed, current file: /builds/Raghul01/backend/services/purchasing/purchasing.js
INFO: 1/37 file analyzed, current file: /builds/Raghul01/backend/services/purchasing/purchasing.js
INFO: 1/37 file analyzed, current file: /builds/Raghul01/backend/services/purchasing/purchasing.js
ERROR:
ERROR: <--- Last few GCs --->
ERROR:
ERROR: [60:0x7f3a008ac220] 38308 ms: Mark-sweep (reduce) 1840.0 (1874.9) -> 1839.0 (1870.9) MB, 1408.7 / 0.0 ms (+ 307.1 ms in 49 steps since start of marking, biggest step 15.1 ms, walltime since start of marking 1797 ms) (average mu = 0.436, current mu = 0[60:0x7f3a008ac220] 41500 ms: Mark-sweep (reduce) 1840.1 (1870.9) -> 1839.5 (1871.6) MB, 3183.4 / 0.0 ms (average mu = 0.202, current mu = 0.003) allocation failure; scavenge might not succeed
ERROR:
ERROR:
ERROR: <--- JS stacktrace --->
ERROR:
ERROR: FATAL ERROR: Reached heap limit Allocation failed - JavaScript heap out of memory
ERROR: eslint-bridge Node.js process is unresponsive. This is most likely caused by process running out of memory. Consider setting sonar.javascript.node.maxspace to higher value (e.g. 4096).
ERROR: Failure during analysis, Node.js command to start eslint-bridge was: node /builds/Raghul01/backend/.scannerwork/.sonartmp/eslint-bridge-bundle/package/bin/server 34129 127.0.0.1 /builds/Raghul01/backend/.scannerwork true false /builds/Raghul01/backend/.scannerwork/.sonartmp/eslint-bridge-bundle/package/custom-rules14105944950475306909/package
java.lang.IllegalStateException: eslint-bridge is unresponsive
at org.sonar.plugins.javascript.eslint.EslintBridgeServerImpl.request(EslintBridgeServerImpl.java:306)
at org.sonar.plugins.javascript.eslint.EslintBridgeServerImpl.analyzeJavaScript(EslintBridgeServerImpl.java:263)
at org.sonar.plugins.javascript.eslint.JavaScriptEslintBasedSensor.analyze(JavaScriptEslintBasedSensor.java:119)
at org.sonar.plugins.javascript.eslint.JavaScriptEslintBasedSensor.runEslintAnalysis(JavaScriptEslintBasedSensor.java:97)
at org.sonar.plugins.javascript.eslint.JavaScriptEslintBasedSensor.analyzeFiles(JavaScriptEslintBasedSensor.java:74)
at org.sonar.plugins.javascript.eslint.AbstractEslintSensor.execute(AbstractEslintSensor.java:69)
at org.sonar.scanner.sensor.AbstractSensorWrapper.analyse(AbstractSensorWrapper.java:62)
at org.sonar.scanner.sensor.ModuleSensorsExecutor.execute(ModuleSensorsExecutor.java:75)
at org.sonar.scanner.sensor.ModuleSensorsExecutor.lambda$execute$1(ModuleSensorsExecutor.java:48)
at org.sonar.scanner.sensor.ModuleSensorsExecutor.withModuleStrategy(ModuleSensorsExecutor.java:66)
at org.sonar.scanner.sensor.ModuleSensorsExecutor.execute(ModuleSensorsExecutor.java:48)
at org.sonar.scanner.scan.ModuleScanContainer.doAfterStart(ModuleScanContainer.java:64)
at org.sonar.core.platform.ComponentContainer.startComponents(ComponentContainer.java:123)
at org.sonar.core.platform.ComponentContainer.execute(ComponentContainer.java:109)
at org.sonar.scanner.scan.ProjectScanContainer.scan(ProjectScanContainer.java:468)
at org.sonar.scanner.scan.ProjectScanContainer.scanRecursively(ProjectScanContainer.java:464)
at org.sonar.scanner.scan.ProjectScanContainer.doAfterStart(ProjectScanContainer.java:420)
at org.sonar.core.platform.ComponentContainer.startComponents(ComponentContainer.java:123)
at org.sonar.core.platform.ComponentContainer.execute(ComponentContainer.java:109)
at org.sonar.scanner.bootstrap.GlobalContainer.doAfterStart(GlobalContainer.java:130)
at org.sonar.core.platform.ComponentContainer.startComponents(ComponentContainer.java:123)
at org.sonar.core.platform.ComponentContainer.execute(ComponentContainer.java:109)
at org.sonar.batch.bootstrapper.Batch.doExecute(Batch.java:58)
at org.sonar.batch.bootstrapper.Batch.execute(Batch.java:52)
at org.sonarsource.scanner.api.internal.batch.BatchIsolatedLauncher.execute(BatchIsolatedLauncher.java:46)
at java.base/jdk.internal.reflect.NativeMethodAccessorImpl.invoke0(Native Method)
at java.base/jdk.internal.reflect.NativeMethodAccessorImpl.invoke(NativeMethodAccessorImpl.java:62)
at java.base/jdk.internal.reflect.DelegatingMethodAccessorImpl.invoke(DelegatingMethodAccessorImpl.java:43)
at java.base/java.lang.reflect.Method.invoke(Method.java:566)
at org.sonarsource.scanner.api.internal.IsolatedLauncherProxy.invoke(IsolatedLauncherProxy.java:60)
at com.sun.proxy.$Proxy0.execute(Unknown Source)
at org.sonarsource.scanner.api.EmbeddedScanner.doExecute(EmbeddedScanner.java:189)
at org.sonarsource.scanner.api.EmbeddedScanner.execute(EmbeddedScanner.java:138)
at org.sonarsource.scanner.cli.Main.execute(Main.java:126)
at org.sonarsource.scanner.cli.Main.execute(Main.java:81)
at org.sonarsource.scanner.cli.Main.main(Main.java:62)
Caused by: java.io.IOException: HTTP/1.1 header parser received no bytes
at java.net.http/jdk.internal.net.http.HttpClientImpl.send(HttpClientImpl.java:565)
at java.net.http/jdk.internal.net.http.HttpClientFacade.send(HttpClientFacade.java:119)
at org.sonar.plugins.javascript.eslint.EslintBridgeServerImpl.request(EslintBridgeServerImpl.java:298)
... 35 common frames omitted
Caused by: java.io.IOException: HTTP/1.1 header parser received no bytes
at java.net.http/jdk.internal.net.http.common.Utils.wrapWithExtraDetail(Utils.java:327)
at java.net.http/jdk.internal.net.http.Http1Response$HeadersReader.onReadError(Http1Response.java:673)
at java.net.http/jdk.internal.net.http.Http1AsyncReceiver.checkForErrors(Http1AsyncReceiver.java:297)
at java.net.http/jdk.internal.net.http.Http1AsyncReceiver.flush(Http1AsyncReceiver.java:263)
at java.net.http/jdk.internal.net.http.common.SequentialScheduler$SynchronizedRestartableTask.run(SequentialScheduler.java:175)
at java.net.http/jdk.internal.net.http.common.SequentialScheduler$CompleteRestartableTask.run(SequentialScheduler.java:147)
at java.net.http/jdk.internal.net.http.common.SequentialScheduler$SchedulableTask.run(SequentialScheduler.java:198)
at java.base/java.util.concurrent.ThreadPoolExecutor.runWorker(ThreadPoolExecutor.java:1128)
at java.base/java.util.concurrent.ThreadPoolExecutor$Worker.run(ThreadPoolExecutor.java:628)
at java.base/java.lang.Thread.run(Thread.java:829)
Caused by: java.io.EOFException: EOF reached while reading
at java.net.http/jdk.internal.net.http.Http1AsyncReceiver$Http1TubeSubscriber.onComplete(Http1AsyncReceiver.java:591)
at java.net.http/jdk.internal.net.http.SocketTube$InternalReadPublisher$ReadSubscription.signalCompletion(SocketTube.java:632)
at java.net.http/jdk.internal.net.http.SocketTube$InternalReadPublisher$InternalReadSubscription.read(SocketTube.java:833)
at java.net.http/jdk.internal.net.http.SocketTube$SocketFlowTask.run(SocketTube.java:175)
at java.net.http/jdk.internal.net.http.common.SequentialScheduler$SchedulableTask.run(SequentialScheduler.java:198)
at java.net.http/jdk.internal.net.http.common.SequentialScheduler.runOrSchedule(SequentialScheduler.java:271)
at java.net.http/jdk.internal.net.http.common.SequentialScheduler.runOrSchedule(SequentialScheduler.java:224)
at java.net.http/jdk.internal.net.http.SocketTube$InternalReadPublisher$InternalReadSubscription.signalReadable(SocketTube.java:763)
at java.net.http/jdk.internal.net.http.SocketTube$InternalReadPublisher$ReadEvent.signalEvent(SocketTube.java:941)
at java.net.http/jdk.internal.net.http.SocketTube$SocketFlowEvent.handle(SocketTube.java:245)
at java.net.http/jdk.internal.net.http.HttpClientImpl$SelectorManager.handleEvent(HttpClientImpl.java:957)
at java.net.http/jdk.internal.net.http.HttpClientImpl$SelectorManager.lambda$run$3(HttpClientImpl.java:912)
at java.base/java.util.ArrayList.forEach(ArrayList.java:1541)
at java.net.http/jdk.internal.net.http.HttpClientImpl$SelectorManager.run(HttpClientImpl.java:912)
INFO: Hit the cache for 0 out of 1
INFO: Miss the cache for 1 out of 1: ANALYSIS_MODE_INELIGIBLE [1/1]
INFO: Sensor JavaScript analysis [javascript] (done) | time=44740ms
INFO: Sensor TypeScript analysis [javascript]
INFO: No input files found for analysis
INFO: Hit the cache for 0 out of 0
INFO: Miss the cache for 0 out of 0
INFO: Sensor TypeScript analysis [javascript] (done) | time=4ms
INFO: Sensor CSS Rules [javascript]
INFO: No CSS, PHP, HTML or VueJS files are found in the project. CSS analysis is skipped.
INFO: Sensor CSS Rules [javascript] (done) | time=2ms
INFO: Sensor ThymeLeaf template sensor [securityjavafrontend]
INFO: Sensor ThymeLeaf template sensor [securityjavafrontend] (done) | time=6ms
INFO: Sensor Serverless configuration file sensor [security]
INFO: 0 Serverless function entries were found in the project
INFO: 0 Serverless function handlers were kept as entrypoints
INFO: Sensor Serverless configuration file sensor [security] (done) | time=48ms
INFO: Sensor AWS SAM template file sensor [security]
INFO: Sensor AWS SAM template file sensor [security] (done) | time=2ms
INFO: Sensor AWS SAM Inline template file sensor [security]
INFO: Sensor AWS SAM Inline template file sensor [security] (done) | time=1ms
INFO: Sensor javabugs [dbd]
INFO: Reading IR files from: /builds/Raghul01/backend/.scannerwork/ir/java
INFO: No IR files have been included for analysis.
INFO: Sensor javabugs [dbd] (done) | time=3ms
INFO: Sensor pythonbugs [dbd]
INFO: Reading IR files from: /builds/Raghul01/backend/.scannerwork/ir/python
INFO: No IR files have been included for analysis.
INFO: Sensor pythonbugs [dbd] (done) | time=17ms
INFO: Sensor JavaSecuritySensor [security]
INFO: Reading type hierarchy from: /builds/Raghul01/backend/.scannerwork/ucfg2/java
INFO: Read 0 type definitions
INFO: No UCFGs have been included for analysis.
INFO: Sensor JavaSecuritySensor [security] (done) | time=10ms
INFO: Sensor CSharpSecuritySensor [security]
INFO: Reading type hierarchy from: /builds/Raghul01/backend/ucfg_cs2
INFO: Read 0 type definitions
INFO: No UCFGs have been included for analysis.
INFO: Sensor CSharpSecuritySensor [security] (done) | time=2ms
INFO: Sensor PhpSecuritySensor [security]
INFO: Reading type hierarchy from: /builds/Raghul01/backend/.scannerwork/ucfg2/php
INFO: Read 0 type definitions
INFO: No UCFGs have been included for analysis.
INFO: Sensor PhpSecuritySensor [security] (done) | time=2ms
INFO: Sensor PythonSecuritySensor [security]
INFO: Reading type hierarchy from: /builds/Raghul01/backend/.scannerwork/ucfg2/python
INFO: Read 0 type definitions
INFO: No UCFGs have been included for analysis.
INFO: Sensor PythonSecuritySensor [security] (done) | time=1ms
INFO: Sensor JsSecuritySensor [security]
INFO: Reading type hierarchy from: /builds/Raghul01/backend/.scannerwork/ucfg2/js
INFO: Read 0 type definitions
INFO: No UCFGs have been included for analysis.
INFO: Sensor JsSecuritySensor [security] (done) | time=1ms
INFO: ------------- Run sensors on project
INFO: Sensor Analysis Warnings import [csharp]
INFO: Sensor Analysis Warnings import [csharp] (done) | time=3ms
INFO: Sensor Zero Coverage Sensor
INFO: Sensor Zero Coverage Sensor (done) | time=5ms
INFO: CPD Executor Calculating CPD for 0 files
INFO: CPD Executor CPD calculation finished (done) | time=0ms
INFO: SCM writing changed lines
INFO: SCM writing changed lines (done) | time=35ms
INFO: Analysis report generated in 784ms, dir size=207 KB
INFO: Analysis report compressed in 50ms, zip size=47 KB
INFO: Analysis report uploaded in 900ms
INFO: ANALYSIS SUCCESSFUL, you can find the results at: https://sonarcloud.io/dashboard?id=Raghul01_backend&branch=sonar&resolved=false
INFO: Note that you will be able to access the updated dashboard once the server has processed the submitted analysis report
INFO: More about the report processing at https://sonarcloud.io/api/ce/task?id=AYV9lVBIKEyoXjzOwD-v
INFO: Sensor cache published successfully
INFO: Analysis total time: 1:08.739 s
INFO: ------------------------------------------------------------------------
INFO: EXECUTION SUCCESS
INFO: ------------------------------------------------------------------------
INFO: Total time: 1:13.989s
INFO: Final Memory: 35M/104M
INFO: ------------------------------------------------------------------------
Hi,
Welcome to the community!
I’ve added your full analysis log post to this thread for you (and formatted both posts).
In the future, do please try to keep all the relevant information together in the same thread. ![]()
You seem to be running an old scanner version (4.8) against an EOL SonarQube version (8.0). You should upgrade SonarQube to either the latest version or the current LTS at your earliest convenience. Your upgrade path is:
8.0 → 8.9.10 → 9.8 (last step optional)
(Note that the release of a new LTS, 9.9, is expected on 7 Feb 2023.)
You may find the Upgrade Guide helpful. If you have questions about upgrading, feel free to open a new thread for that here.
You’ll need to upgrade the scanner as well. It’s not clear to me what version of Node.js you have installed on the build agent, but you’ll need to make sure you’re on a recent version.
If your error persists after the upgrades, please come back to us.
Ann
Hi,
I don’t understand what you mean by this, but your new log also indicates you’re using SonarQube 8.0. You’ll need to upgrade all the relevant components before we can help you with anything.
Ann
Issues in sonarcloud not in sonarQube. We are scanning the code in gitlab
Thanks!!!
1 Like
Doh!
Okay, can you upgrade your scanner and make sure your Node.js is on a recent version and try again?
Thx,
Ann
1 Like
Hi,
Thanks for your patience. I’ve flagged this for more expert attention.
Ann
We are facing this issue almost 1month. still going
How can we upgrade the sonarqube version?
Hi,
Sorry, but when I was looking at your logs I overlooked the fact that you filed this in the SonarCloud category, so that version stamp I saw in your logs is a total red herring that I should have ignored. Since you’re on the latest scanner (I was wrong about that too!!!) and Node.js version, then I’m not sure there’s much else you can do until we get some more expert input.
Ann
yes can you please help on this issue
Hello raghul,
Could you increase the memory available to your VM on GitLab?
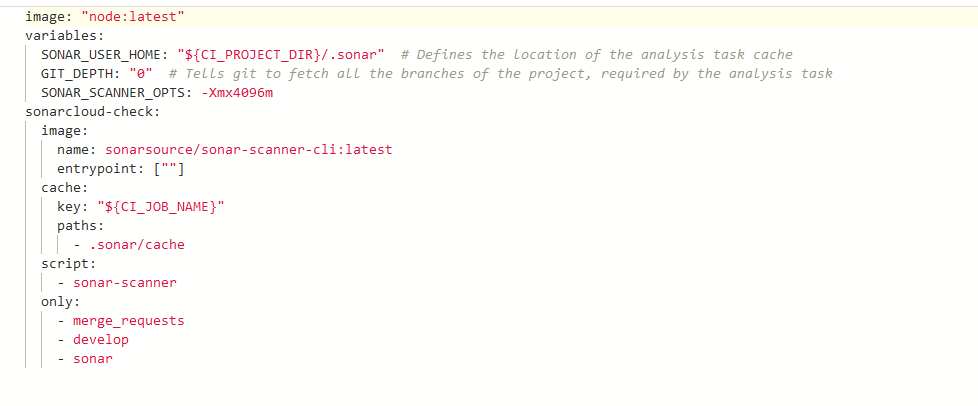
Also, you could try to increase the memory available to the Scanner with the following option:
SONAR_SCANNER_OPTS="-Xmx512m"
Best Regards,
Ilia
Hello llia,
Yes, i have updated with ```
SONAR_SCANNER_OPTS=“-Xmx4096m”. But its not working
Is there any update on my ticket?
There is no update from your team. Still we are facing issue
Hello raghul,
What about the memory available in your environment on GitLab? Do you know how much RAM you have available there? Can you increase this value?
Best Regards,
Ilia
Hello llia,
Currently we have 4 GB Memory in Gitlab environment. We have increased up to 8 GB
Thanks!!
Hello raghul,
Did increasing the RAM fix your issue?
Best Regards,
Ilia