Using GitHub + GitHub Actions.
The languages of the repo are typescript/scss/handlebars/js/shell.
I was performing the initial setup with GitHub actions.
Added sonar-project.properties file with default values proposed by platform.
Set a secret SONAR_TOKEN for the repo and added a workflow for GitHub Actions.
First Github Action run failed for my PR with
INFO: 3563/9298 files analyzed, current file: /github/workspace/src/***.ts
ERROR:
ERROR: <--- Last few GCs --->
ERROR:
ERROR: [63:0x7fee306cb220]   114514 ms: Scavenge (reduce) 2037.2 (2082.1) -> 2037.0 (2083.1) MB, 4.4 / 0.0 ms  (average mu = 0.424, current mu = 0.276) allocation failure;
ERROR: [63:0x7fee306cb220]   116283 ms: Mark-sweep (reduce) 2038.0 (2083.1) -> 2037.6 (2083.6) MB, 1766.7 / 0.0 ms  (average mu = 0.238, current mu = 0.012) allocation failure; scavenge might not succeed
ERROR:
ERROR:
ERROR: <--- JS stacktrace --->
ERROR:
ERROR: FATAL ERROR: Reached heap limit Allocation failed - JavaScript heap out of memory
ERROR: eslint-bridge Node.js process is unresponsive. This is most likely caused by process running out of memory. Consider setting sonar.javascript.node.maxspace to higher value (e.g. 4096).
ERROR: Failure during analysis, Node.js command to start eslint-bridge was: node /github/workspace/.scannerwork/.sonartmp/eslint-bridge-bundle/package/bin/server 37383 127.0.0.1 /github/workspace/.scannerwork true false /github/workspace/.scannerwork/.sonartmp/eslint-bridge-bundle/package/custom-rules7412835759426370468/package
java.lang.IllegalStateException: eslint-bridge is unresponsive
	at org.sonar.plugins.javascript.eslint.EslintBridgeServerImpl.request(EslintBridgeServerImpl.java:305)
	at org.sonar.plugins.javascript.eslint.EslintBridgeServerImpl.analyzeWithProgram(EslintBridgeServerImpl.java:273)
	at org.sonar.plugins.javascript.eslint.AnalysisWithProgram.analyze(AnalysisWithProgram.java:166)
	at org.sonar.plugins.javascript.eslint.AnalysisWithProgram.analyzeProgram(AnalysisWithProgram.java:144)
	at org.sonar.plugins.javascript.eslint.AnalysisWithProgram.analyzeFiles(AnalysisWithProgram.java:109)
	at org.sonar.plugins.javascript.eslint.TypeScriptSensor.analyzeFiles(TypeScriptSensor.java:95)
	at org.sonar.plugins.javascript.eslint.AbstractEslintSensor.execute(AbstractEslintSensor.java:69)
	at org.sonar.scanner.sensor.AbstractSensorWrapper.analyse(AbstractSensorWrapper.java:62)
	at org.sonar.scanner.sensor.ModuleSensorsExecutor.execute(ModuleSensorsExecutor.java:75)
	at org.sonar.scanner.sensor.ModuleSensorsExecutor.lambda$execute$1(ModuleSensorsExecutor.java:48)
	at org.sonar.scanner.sensor.ModuleSensorsExecutor.withModuleStrategy(ModuleSensorsExecutor.java:66)
	at org.sonar.scanner.sensor.ModuleSensorsExecutor.execute(ModuleSensorsExecutor.java:48)
	at org.sonar.scanner.scan.ModuleScanContainer.doAfterStart(ModuleScanContainer.java:64)
	at org.sonar.core.platform.ComponentContainer.startComponents(ComponentContainer.java:123)
	at org.sonar.core.platform.ComponentContainer.execute(ComponentContainer.java:109)
	at org.sonar.scanner.scan.ProjectScanContainer.scan(ProjectScanContainer.java:468)
	at org.sonar.scanner.scan.ProjectScanContainer.scanRecursively(ProjectScanContainer.java:464)
	at org.sonar.scanner.scan.ProjectScanContainer.doAfterStart(ProjectScanContainer.java:420)
	at org.sonar.core.platform.ComponentContainer.startComponents(ComponentContainer.java:123)
	at org.sonar.core.platform.ComponentContainer.execute(ComponentContainer.java:109)
	at org.sonar.scanner.bootstrap.GlobalContainer.doAfterStart(GlobalContainer.java:130)
	at org.sonar.core.platform.ComponentContainer.startComponents(ComponentContainer.java:123)
	at org.sonar.core.platform.ComponentContainer.execute(ComponentContainer.java:109)
	at org.sonar.batch.bootstrapper.Batch.doExecute(Batch.java:58)
	at org.sonar.batch.bootstrapper.Batch.execute(Batch.java:52)
	at org.sonarsource.scanner.api.internal.batch.BatchIsolatedLauncher.execute(BatchIsolatedLauncher.java:46)
	at java.base/jdk.internal.reflect.NativeMethodAccessorImpl.invoke0(Native Method)
	at java.base/jdk.internal.reflect.NativeMethodAccessorImpl.invoke(NativeMethodAccessorImpl.java:62)
	at java.base/jdk.internal.reflect.DelegatingMethodAccessorImpl.invoke(DelegatingMethodAccessorImpl.java:43)
	at java.base/java.lang.reflect.Method.invoke(Method.java:566)
	at org.sonarsource.scanner.api.internal.IsolatedLauncherProxy.invoke(IsolatedLauncherProxy.java:60)
	at com.sun.proxy.$Proxy0.execute(Unknown Source)
	at org.sonarsource.scanner.api.EmbeddedScanner.doExecute(EmbeddedScanner.java:189)
	at org.sonarsource.scanner.api.EmbeddedScanner.execute(EmbeddedScanner.java:138)
	at org.sonarsource.scanner.cli.Main.execute(Main.java:112)
	at org.sonarsource.scanner.cli.Main.execute(Main.java:75)
	at org.sonarsource.scanner.cli.Main.main(Main.java:61)
Caused by: java.io.IOException: HTTP/1.1 header parser received no bytes
	at java.net.http/jdk.internal.net.http.HttpClientImpl.send(HttpClientImpl.java:565)
	at java.net.http/jdk.internal.net.http.HttpClientFacade.send(HttpClientFacade.java:119)
	at org.sonar.plugins.javascript.eslint.EslintBridgeServerImpl.request(EslintBridgeServerImpl.java:297)
	... 36 common frames omitted
Caused by: java.io.IOException: HTTP/1.1 header parser received no bytes
	at java.net.http/jdk.internal.net.http.common.Utils.wrapWithExtraDetail(Utils.java:327)
	at java.net.http/jdk.internal.net.http.Http1Response$HeadersReader.onReadError(Http1Response.java:673)
	at java.net.http/jdk.internal.net.http.Http1AsyncReceiver.checkForErrors(Http1AsyncReceiver.java:297)
	at java.net.http/jdk.internal.net.http.Http1AsyncReceiver.flush(Http1AsyncReceiver.java:263)
	at java.net.http/jdk.internal.net.http.common.SequentialScheduler$SynchronizedRestartableTask.run(SequentialScheduler.java:175)
	at java.net.http/jdk.internal.net.http.common.SequentialScheduler$CompleteRestartableTask.run(SequentialScheduler.java:147)
	at java.net.http/jdk.internal.net.http.common.SequentialScheduler$SchedulableTask.run(SequentialScheduler.java:198)
	at java.base/java.util.concurrent.ThreadPoolExecutor.runWorker(ThreadPoolExecutor.java:1128)
	at java.base/java.util.concurrent.ThreadPoolExecutor$Worker.run(ThreadPoolExecutor.java:628)
	at java.base/java.lang.Thread.run(Thread.java:829)
Caused by: java.io.EOFException: EOF reached while reading
	at java.net.http/jdk.internal.net.http.Http1AsyncReceiver$Http1TubeSubscriber.onComplete(Http1AsyncReceiver.java:591)
	at java.net.http/jdk.internal.net.http.SocketTube$InternalReadPublisher$ReadSubscription.signalCompletion(SocketTube.java:632)
	at java.net.http/jdk.internal.net.http.SocketTube$InternalReadPublisher$InternalReadSubscription.read(SocketTube.java:833)
	at java.net.http/jdk.internal.net.http.SocketTube$SocketFlowTask.run(SocketTube.java:175)
	at java.net.http/jdk.internal.net.http.common.SequentialScheduler$SchedulableTask.run(SequentialScheduler.java:198)
	at java.net.http/jdk.internal.net.http.common.SequentialScheduler.runOrSchedule(SequentialScheduler.java:271)
	at java.net.http/jdk.internal.net.http.common.SequentialScheduler.runOrSchedule(SequentialScheduler.java:224)
	at java.net.http/jdk.internal.net.http.SocketTube$InternalReadPublisher$InternalReadSubscription.signalReadable(SocketTube.java:763)
	at java.net.http/jdk.internal.net.http.SocketTube$InternalReadPublisher$ReadEvent.signalEvent(SocketTube.java:941)
	at java.net.http/jdk.internal.net.http.SocketTube$SocketFlowEvent.handle(SocketTube.java:245)
	at java.net.http/jdk.internal.net.http.HttpClientImpl$SelectorManager.handleEvent(HttpClientImpl.java:957)
	at java.net.http/jdk.internal.net.http.HttpClientImpl$SelectorManager.lambda$run$3(HttpClientImpl.java:912)
	at java.base/java.util.ArrayList.forEach(ArrayList.java:1541)
	at java.net.http/jdk.internal.net.http.HttpClientImpl$SelectorManager.run(HttpClientImpl.java:912)

INFO: Hit the cache for 0 out of 3563
INFO: Miss the cache for 3563 out of 3563: FILE_CHANGED [3563/3563]
INFO: Sensor TypeScript analysis [javascript] (done) | time=111454ms
INFO: Sensor JavaScript inside YAML analysis [javascript]
INFO: No input files found for analysis
INFO: Hit the cache for 0 out of 0
INFO: Miss the cache for 0 out of 0
INFO: Sensor JavaScript inside YAML analysis [javascript] (done) | time=6ms
INFO: Sensor CSS Rules [javascript]
INFO: Sensor CSS Rules is restricted to changed files only
INFO: No CSS, PHP, HTML or VueJS files are found in the project. CSS analysis is skipped.
INFO: Sensor CSS Rules [javascript] (done) | time=8ms
INFO: Sensor CSS Metrics [javascript]
INFO: Sensor CSS Metrics is restricted to changed files only
INFO: Sensor CSS Metrics [javascript] (done) | time=2ms
INFO: Sensor ThymeLeaf template sensor [securityjavafrontend]
INFO: Sensor ThymeLeaf template sensor [securityjavafrontend] (done) | time=17ms
INFO: Sensor IaC Docker Sensor [iac]
INFO: Sensor IaC Docker Sensor is restricted to changed files only
INFO: 0 source files to be analyzed
INFO: 0/0 source files have been analyzed
INFO: Sensor IaC Docker Sensor [iac] (done) | time=165ms
INFO: Sensor Serverless configuration file sensor [security]
INFO: 0 Serverless function entries were found in the project
INFO: 0 Serverless function handlers were kept as entrypoints
INFO: Sensor Serverless configuration file sensor [security] (done) | time=12ms
INFO: Sensor AWS SAM template file sensor [security]
INFO: Sensor AWS SAM template file sensor [security] (done) | time=11ms
INFO: Sensor AWS SAM Inline template file sensor [security]
INFO: Sensor AWS SAM Inline template file sensor [security] (done) | time=10ms
INFO: Sensor javabugs [dbd]
INFO: Reading IR files from: /github/workspace/.scannerwork/ir/java
INFO: No IR files have been included for analysis.
INFO: Sensor javabugs [dbd] (done) | time=1ms
INFO: Sensor pythonbugs [dbd]
INFO: Reading IR files from: /github/workspace/.scannerwork/ir/python
INFO: No IR files have been included for analysis.
INFO: Sensor pythonbugs [dbd] (done) | time=2ms
INFO: Sensor JavaSecuritySensor [security]
INFO: Reading type hierarchy from: /github/workspace/.scannerwork/ucfg2/java
INFO: Read 0 type definitions
INFO: No UCFGs have been included for analysis.
INFO: Sensor JavaSecuritySensor [security] (done) | time=4ms
INFO: Sensor CSharpSecuritySensor [security]
INFO: Reading type hierarchy from: /github/workspace/ucfg_cs2
INFO: Read 0 type definitions
INFO: No UCFGs have been included for analysis.
INFO: Sensor CSharpSecuritySensor [security] (done) | time=1ms
INFO: Sensor PhpSecuritySensor [security]
INFO: Reading type hierarchy from: /github/workspace/.scannerwork/ucfg2/php
INFO: Read 0 type definitions
INFO: No UCFGs have been included for analysis.
INFO: Sensor PhpSecuritySensor [security] (done) | time=1ms
INFO: Sensor PythonSecuritySensor [security]
INFO: Reading type hierarchy from: /github/workspace/.scannerwork/ucfg2/python
INFO: Read 0 type definitions
INFO: No UCFGs have been included for analysis.
INFO: Sensor PythonSecuritySensor [security] (done) | time=1ms
INFO: Sensor JsSecuritySensor [security]
INFO: Reading type hierarchy from: /github/workspace/.scannerwork/ucfg2/js
INFO: Read 0 type definitions
INFO: Reading UCFGs from: /github/workspace/.scannerwork/ucfg2/js
INFO: 16:06:17.158658 Building Runtime Type propagation graph
INFO: 16:06:18.040127 Running Tarjan on 144202 nodes
INFO: 16:06:18.237361 Tarjan found 144172 components
INFO: 16:06:18.490987 Variable type analysis: done
INFO: 16:06:18.493476 Building Runtime Type propagation graph
INFO: 16:06:19.432716 Running Tarjan on 144202 nodes
INFO: 16:06:19.505972 Tarjan found 144172 components
INFO: 16:06:20.033832 Variable type analysis: done
INFO: Analyzing 17279 ucfgs to detect vulnerabilities.
INFO: Taint analysis starting. Entrypoints: 3578
INFO: Running symbolic analysis for 'JS'
INFO: Taint analysis: done.
INFO: Sensor JsSecuritySensor [security] (done) | time=134290ms
INFO: ------------- Run sensors on project
INFO: Sensor Analysis Warnings import [csharp]
INFO: Sensor Analysis Warnings import [csharp] (done) | time=2ms
INFO: Sensor Zero Coverage Sensor
INFO: Sensor Zero Coverage Sensor (done) | time=248ms
INFO: CPD Executor 693 files had no CPD blocks
INFO: CPD Executor Calculating CPD for 2884 files
WARN: Too many duplication groups on file src/common/***.ts. Keep only the first 100 groups.
INFO: CPD Executor CPD calculation finished (done) | time=527ms
INFO: SCM writing changed lines
INFO: SCM writing changed lines (done) | time=34ms
INFO: Analysis report generated in 546ms, dir size=3 MB
INFO: Analysis report compressed in 4981ms, zip size=4 MB
INFO: ------------------------------------------------------------------------
INFO: EXECUTION FAILURE
INFO: ------------------------------------------------------------------------
INFO: Total time: 5:00.439s
ERROR: Error during SonarScanner execution
INFO: Final Memory: 878M/1700M
ERROR: Project not found. Please check the 'sonar.projectKey' and 'sonar.organization' properties, the 'SONAR_TOKEN' environment variable, or contact the project administrator
ERROR:
ERROR: Re-run SonarScanner using the -X switch to enable full debug logging.
INFO: ------------------------------------------------------------------------
##[debug]Docker Action run completed with exit code 2
##[debug]Finishing: SonarCloud Scan
I’ve made sure that this part is ok
“Project not found. Please check the ‘sonar.projectKey’ and ‘sonar.organization’ properties, the ‘SONAR_TOKEN’ environment variable, or contact the project administrator”
I’ve noticed a memory issue in these logs, so I have added
sonar.javascript.node.maxspace=4096
to sonar-project.properties file.
After that change, my next run is not failing anymore but it is running for a long time already
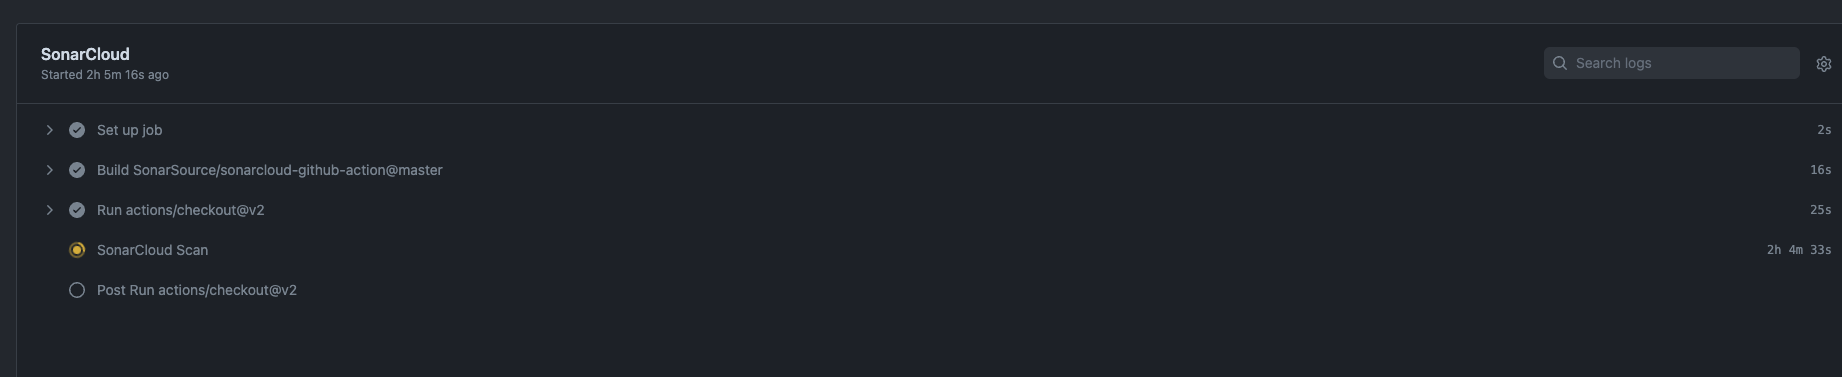
Latest logs that I had for this run were
INFO: 8856/9298 files analyzed, current file: /github/workspace/src/***/**.ts
INFO: Analyzed 5442 file(s) with current program
INFO: Skipped 5 file(s) because they were not part of any tsconfig.json (enable debug logs to see the full list)
INFO: 9298/9298 source files have been analyzed
INFO: Hit the cache for 0 out of 9293
INFO: Miss the cache for 9293 out of 9293: FILE_CHANGED [9293/9293]
INFO: Sensor TypeScript analysis [javascript] (done) | time=269125ms
INFO: Sensor JavaScript inside YAML analysis [javascript]
INFO: No input files found for analysis
INFO: Hit the cache for 0 out of 0
INFO: Miss the cache for 0 out of 0
INFO: Sensor JavaScript inside YAML analysis [javascript] (done) | time=7ms
INFO: Sensor CSS Rules [javascript]
INFO: Sensor CSS Rules is restricted to changed files only
INFO: No CSS, PHP, HTML or VueJS files are found in the project. CSS analysis is skipped.
INFO: Sensor CSS Rules [javascript] (done) | time=11ms
INFO: Sensor CSS Metrics [javascript]
INFO: Sensor CSS Metrics is restricted to changed files only
INFO: Sensor CSS Metrics [javascript] (done) | time=4ms
INFO: Sensor ThymeLeaf template sensor [securityjavafrontend]
INFO: Sensor ThymeLeaf template sensor [securityjavafrontend] (done) | time=18ms
INFO: Sensor IaC Docker Sensor [iac]
INFO: Sensor IaC Docker Sensor is restricted to changed files only
INFO: 0 source files to be analyzed
INFO: 0/0 source files have been analyzed
INFO: Sensor IaC Docker Sensor [iac] (done) | time=202ms
INFO: Sensor Serverless configuration file sensor [security]
INFO: 0 Serverless function entries were found in the project
INFO: 0 Serverless function handlers were kept as entrypoints
INFO: Sensor Serverless configuration file sensor [security] (done) | time=18ms
INFO: Sensor AWS SAM template file sensor [security]
INFO: Sensor AWS SAM template file sensor [security] (done) | time=15ms
INFO: Sensor AWS SAM Inline template file sensor [security]
INFO: Sensor AWS SAM Inline template file sensor [security] (done) | time=11ms
INFO: Sensor javabugs [dbd]
INFO: Reading IR files from: /github/workspace/.scannerwork/ir/java
INFO: No IR files have been included for analysis.
INFO: Sensor javabugs [dbd] (done) | time=1ms
INFO: Sensor pythonbugs [dbd]
INFO: Reading IR files from: /github/workspace/.scannerwork/ir/python
INFO: No IR files have been included for analysis.
INFO: Sensor pythonbugs [dbd] (done) | time=3ms
INFO: Sensor JavaSecuritySensor [security]
INFO: Reading type hierarchy from: /github/workspace/.scannerwork/ucfg2/java
INFO: Read 0 type definitions
INFO: No UCFGs have been included for analysis.
INFO: Sensor JavaSecuritySensor [security] (done) | time=3ms
INFO: Sensor CSharpSecuritySensor [security]
INFO: Reading type hierarchy from: /github/workspace/ucfg_cs2
INFO: Read 0 type definitions
INFO: No UCFGs have been included for analysis.
INFO: Sensor CSharpSecuritySensor [security] (done) | time=1ms
INFO: Sensor PhpSecuritySensor [security]
INFO: Reading type hierarchy from: /github/workspace/.scannerwork/ucfg2/php
INFO: Read 0 type definitions
INFO: No UCFGs have been included for analysis.
INFO: Sensor PhpSecuritySensor [security] (done) | time=2ms
INFO: Sensor PythonSecuritySensor [security]
INFO: Reading type hierarchy from: /github/workspace/.scannerwork/ucfg2/python
INFO: Read 0 type definitions
INFO: No UCFGs have been included for analysis.
INFO: Sensor PythonSecuritySensor [security] (done) | time=1ms
INFO: Sensor JsSecuritySensor [security]
INFO: Reading type hierarchy from: /github/workspace/.scannerwork/ucfg2/js
INFO: Read 0 type definitions
INFO: Reading UCFGs from: /github/workspace/.scannerwork/ucfg2/js
INFO: 16:57:21.942421 Building Runtime Type propagation graph
INFO: 16:57:24.019754 Running Tarjan on 400558 nodes
INFO: 16:57:24.427726 Tarjan found 400493 components
INFO: 16:57:25.844258 Variable type analysis: done
INFO: 16:57:25.847825 Building Runtime Type propagation graph
INFO: 16:57:28.418792 Running Tarjan on 400558 nodes
INFO: 16:57:28.770301 Tarjan found 400493 components
INFO: 16:57:30.24228 Variable type analysis: done
INFO: Analyzing 50179 ucfgs to detect vulnerabilities.
INFO: Taint analysis starting. Entrypoints: 9309
INFO: Running symbolic analysis for 'JS'
Repo is about 600k lines of code.
The dashboard is empty. It proposes me to do the initial setup.