Must-share information:
• SonarQube Version: Developer Edition 9.9 (build 65466)
• Scanner: sonar-scanner-engine-shaded-9.9.6.92038-all
• Coverage Method: Generic Test Coverage
• Project Type: SQL
• Deployment Method: Windows Server
• Database: SQL Server
• Java Version: OpenJDK 17
• Plugins: Default plugins included with Developer Edition 9.9
What are you trying to achieve?
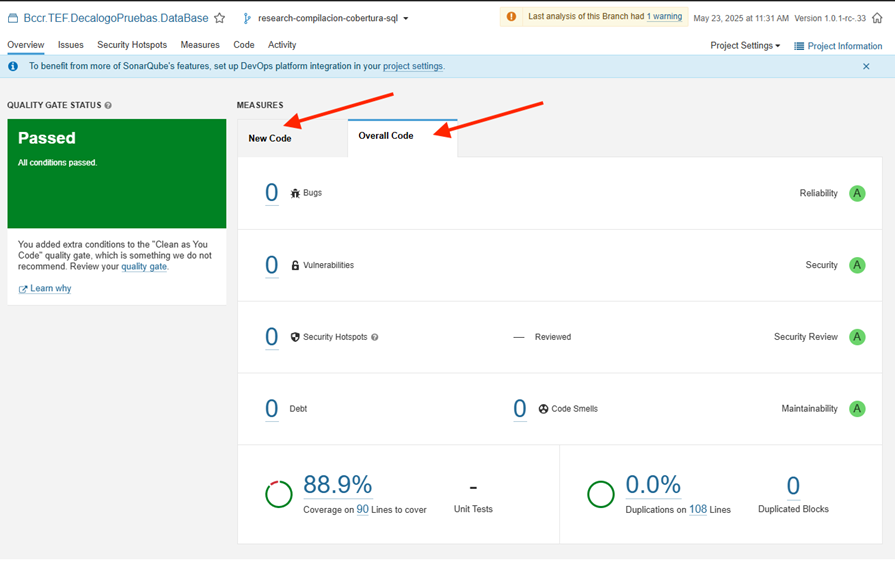
We want to consistently display the Coverage metric in both the “Overall Code” and “New Code” tabs for a SQL project using generic coverage reports.
What is the issue?
After a successful analysis, the Coverage metric appears correctly. However, after a short time (even without any new analysis or code changes), the metric disappears from both the “Overall Code” and “New Code” tabs.
This behavior has been observed:
• Across multiple browsers (Chrome, Edge)
• On different machines and user accounts
• With no changes to the project or configuration
What have you tried so far?
• Re-analyzed the project multiple times
• Verified the generic coverage report is correctly formatted and included in each analysis
• Cleared browser cache and tried different browsers
• Confirmed the issue is not related to UI rendering or local environment
• Consulted SonarQube documentation and community posts
• Contacted SonarSource pre-sales support, who recommended opening this post
Logs (relevant excerpts):
INFO: Sensor JsSecuritySensor [security]
INFO: Reading type hierarchy from: F:\ADSPools\Fortify\agent2_work\8059\s.scannerwork\ucfg2\js
INFO: Read 0 type definitions
INFO: No UCFGs have been included for analysis.
INFO: Sensor JsSecuritySensor [security] (done) | time=0ms
INFO: ------------- Run sensors on project
INFO: Sensor Analysis Warnings import [csharp]
INFO: Sensor Analysis Warnings import [csharp] (done) | time=2ms
INFO: Sensor Zero Coverage Sensor
INFO: Sensor Zero Coverage Sensor (done) | time=1ms
INFO: CPD Executor Calculating CPD for 5 files
INFO: CPD Executor CPD calculation finished (done) | time=175ms
INFO: Load New Code definition
INFO: Load New Code definition (done) | time=15ms
INFO: Analysis report generated in 269ms, dir size=202.6 kB
INFO: Analysis report compressed in 670ms, zip size=30.9 kB
INFO: Analysis report uploaded in 43ms
INFO: ANALYSIS SUCCESSFUL, you can find the results at: http://INSTANCE/dashboard?id=Bccr.TEF.DecalogoPruebas.DataBase&branch=research-compilacion-cobertura-sql
INFO: Note that you will be able to access the updated dashboard once the server has processed the submitted analysis report
INFO: More about the report processing at http://INSTANCE/api/ce/task?id=AZcjBqkRKirh9vgVfUzv
INFO: Analysis total time: 16.690 s
INFO: ------------------------------------------------------------------------
INFO: EXECUTION SUCCESS
INFO: ------------------------------------------------------------------------
INFO: Total time: 20.837s
INFO: Final Memory: 30M/136M
INFO: ------------------------------------------------------------------------
Additional Notes:
• We understand that “New Code” may not always show coverage if no new code is introduced, but we expect “Overall Code” to retain the metric.
• We are considering upgrading to version 2025.3, but would like to confirm whether this is a known issue or if there’s a workaround.

Thanks in advance for your help and insights!
Best regards,