I am writing to request assistance in troubleshooting an issue I am experiencing with code coverage in SonarQube Developer Edition. Specifically, although I generate code coverage reports using dotCover that show 98% coverage, the SonarQube interface displays 0% coverage for my codebase.
I use the following properties with dotnet sonarscanner
dotnet sonarscanner begin /key:{projectKey} /d:sonar.verbose=true /d:sonar.cs.dotcover.reportsPaths=CodeCoverageResults/CodeCoverageResults.html /d:pullrequest.key={PRKey} /d:pullrequest.branch={PRBranch} /d:pullrequest.base=master
[2023-04-26T20:19:41.665Z] 16:19:41.436 DEBUG: Analyzing coverage with wildcardPatternFileProvider with base dir 'C:\j\workspace\Control.Integration.XSight_PR-14\.' and file separator '\'.
[2023-04-26T20:19:41.665Z] 16:19:41.436 DEBUG: Pattern matcher extracted prefix/absolute path 'C:\j\workspace\Control.Integration.XSight_PR-14\.\CodeCoverageResults\CodeCoverageResults.html' from the given pattern 'CodeCoverageResults/CodeCoverageResults.html'.
[2023-04-26T20:19:41.665Z] 16:19:41.436 DEBUG: Pattern matcher returns a single file: 'C:\j\workspace\Control.Integration.XSight_PR-14\.\CodeCoverageResults\CodeCoverageResults.html'.
[2023-04-26T20:19:41.665Z] 16:19:41.436 DEBUG: The current user dir is 'C:\j\workspace\Control.Integration.XSight_PR-14'.
[2023-04-26T20:19:41.665Z] 16:19:41.436 INFO: Aggregating the HTML reports from 'C:\j\workspace\Control.Integration.XSight_PR-14\.\CodeCoverageResults\CodeCoverageResults.html'.
[2023-04-26T20:19:41.665Z] 16:19:41.436 DEBUG: dotCover aggregator: collected 1 report files to parse.
[2023-04-26T20:19:41.665Z] 16:19:41.436 INFO: Adding this code coverage report to the cache for later reuse: C:\j\workspace\Control.Integration.XSight_PR-14\.\CodeCoverageResults\CodeCoverageResults.html
[2023-04-26T20:19:41.665Z] 16:19:41.436 DEBUG: Analyzing coverage after aggregate found '0' coverage files.
[2023-04-26T20:19:41.665Z] 16:19:41.436 DEBUG: The total number of file count statistics is '0'.
[2023-04-26T20:19:41.665Z] 16:19:41.436 INFO: Sensor C# Tests Coverage Report Import [csharp] (done) | time=0ms
[2023-04-26T20:19:41.665Z] 16:19:41.436 INFO: Sensor Zero Coverage Sensor
[2023-04-26T20:19:41.665Z] 16:19:41.451 INFO: Sensor Zero Coverage Sensor (done) | time=15ms
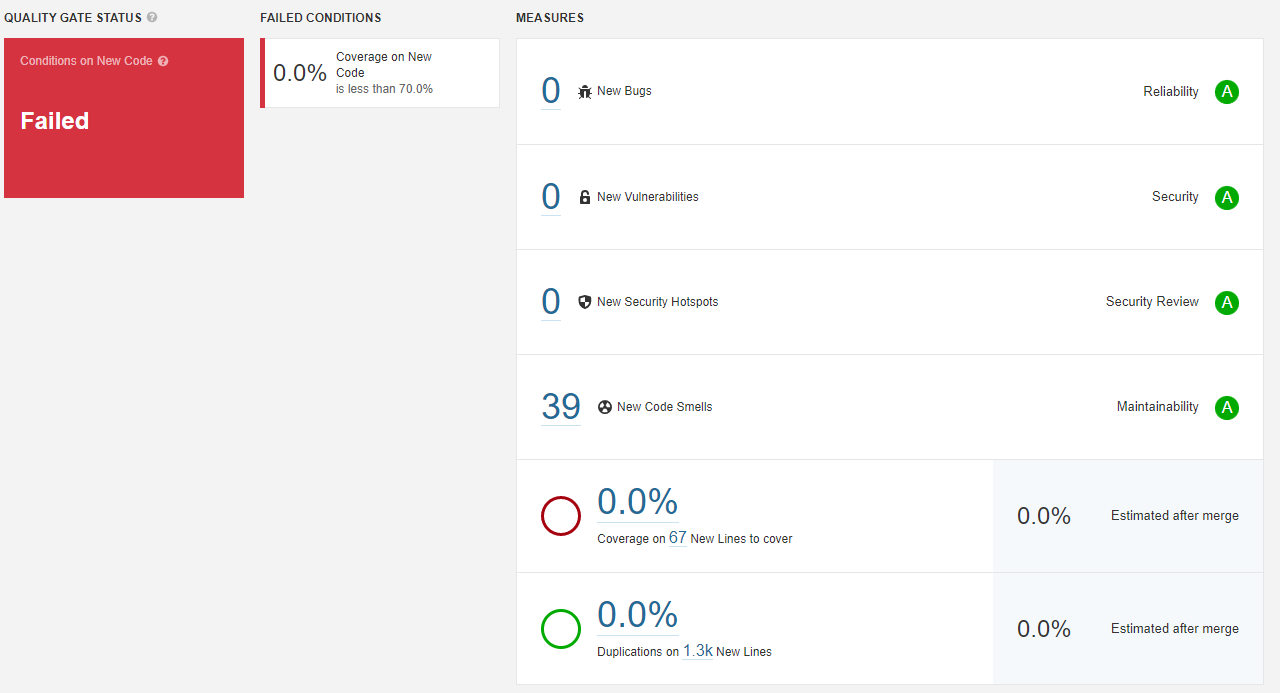
Result in SQ:
dotcover generated HTML file:

I am currently running:
- SonarQube Developer Edition Version 9.4 (build 54424) on Windows.
- Tool ‘dotnet-sonarscanner’ (version ‘5.13.0’)
- JetBrains dotCover Console Runner 2021.2.2. Build 777.0.20211008.82358.
- SonarScanner for MSBuild 5.13.
I have attempted to troubleshoot the issue by reviewing the documentation and forums, but have been unable to find a solution. coverage-troubleshooting-guide-for-net-code-coverage-import