Hi,
We are integrating SonarQube in GitHub build pipeline. On SonarQube UI code coverage showing 0.0%. We have 98% code coverage but it’s not showing on SonarQube UI. We have added these properties. Need help on this.
ecs-ci.yml
  sonar:
    needs: [ java-test ]
    uses: sonarqube.workflow/.github/workflows/maven.yml@v1
    with:
      image-name: maven:3-openjdk-17
pom.xml
<!--SonarQube Properties--><sonar.core.codeCoveragePlugin>jacoco</sonar.core.codeCoveragePlugin>
<sonar.language>java</sonar.language>
<sonar.java.coveragePlugin>jacoco</sonar.java.coveragePlugin>
<sonar.sources>src/main</sonar.sources>
<sonar.tests>src/test</sonar.tests>
<sonar.java.binaries>target/classes</sonar.java.binaries>
<sonar.coverage.jacoco.xmlReportPaths>target/site/jacoco/jacoco.xml</sonar.coverage.jacoco.xmlReportPaths>
</properties>

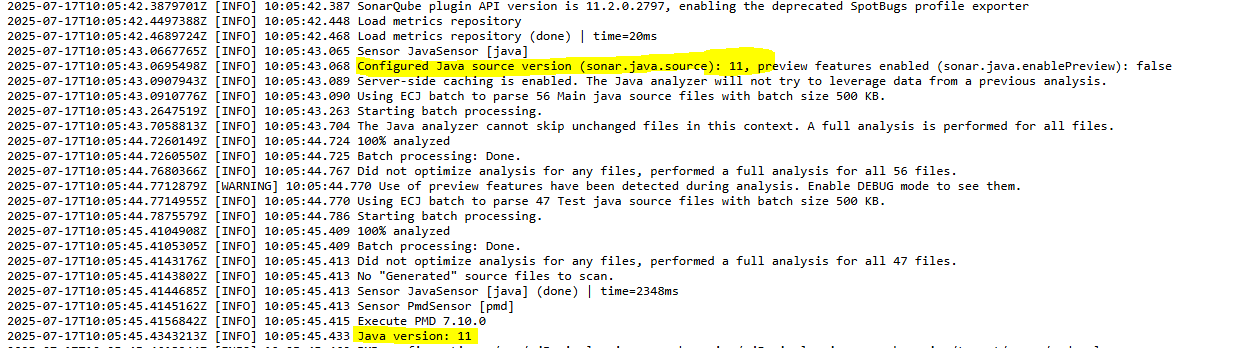
And I see these info in GitHub logs
It pulled Java 11 but we using java 17