I created a project on sonar cloud and a dev branch exists in it and it is showing in Long-Lived Branch and sonar cloud has analyzed it for the first time and when PR is created with the few lines changed sonar cloud is showing a lot of new lines to cover and coverage is showing less than 80% while the change happened only in few lines. Due to this reason Quality Gate is showing Failed status.
I deleted the project and created it again but same thing is happening again.
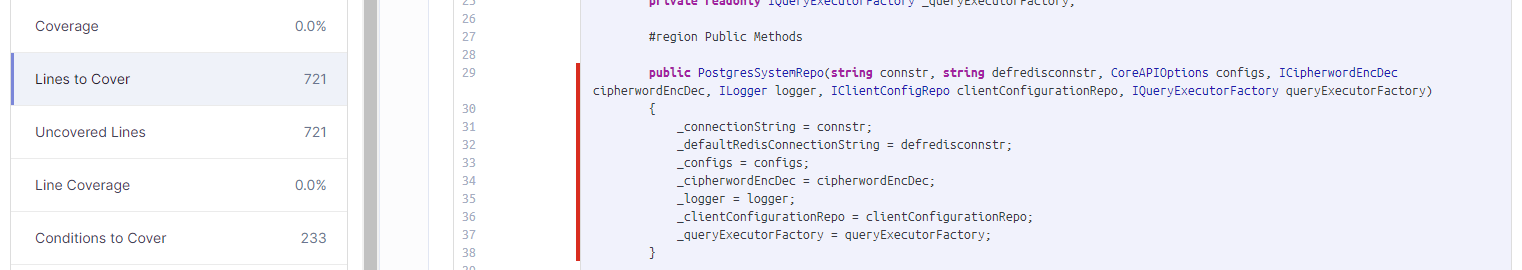
How about some screenshots of these new lines to cover that you think are wrongly detected as such. And also a screenshot of the blame data for a block of those lines. You can get that by clicking in the left margin:
Nonetheless, ultimately ‘lines to cover’ will either be covered or uncovered (or partially covered in the case of conditionals). So yes, you’re seeing red markers to indicate which Lines to Cover are currently uncovered, or still in a “to cover” state.
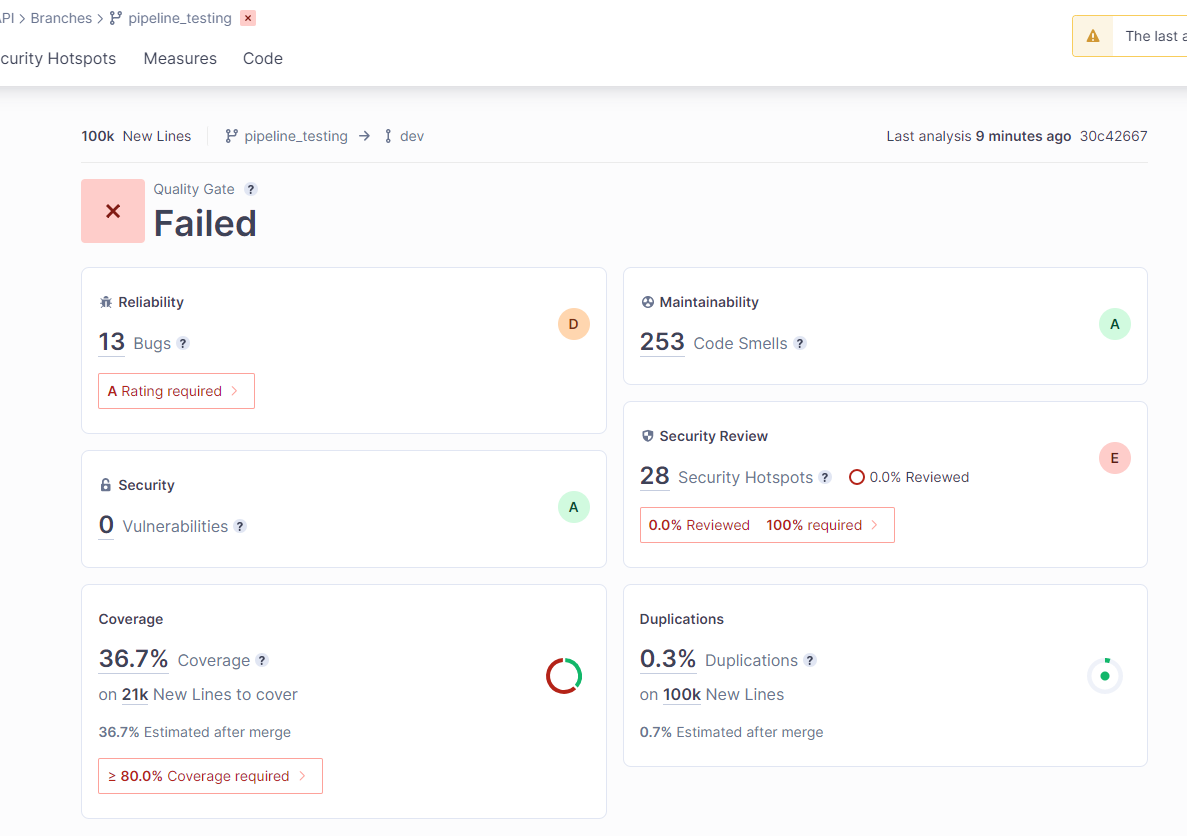
I have created a new testing branch from dev (main branch) and no new lines added but it is still showing 21K new lines to cover in the coverage section while the dev (main branch) is already analyzed, I am attaching the snapshot from testing branch
The analysis / scanner log is what’s output from the analysis command. Hopefully, the log you provide - redacted as necessary - will include that command as well.
Many thanks for guidance, so what kind of information you need from the logs? Logs information is too long so how I can send you the appropriate information from logs?
Please share email address so I can share the logs on email because these are the company project logs so I cannot share these logs on this public forum.
WARN: SCM provider autodetection failed. Please use "sonar.scm.provider" to define SCM of your project, or disable the SCM Sensor in the project settings.
Without SCM data, analysis is going to have a hard time correctly identifying what files / lines are new.
So the question is: how do you obtain the files for analysis? Analysis assumes that it’s kicked off from the project root directory, which is also the SCM root directory. Without the SCM’s dot files (files or directories with names that start with .) present starting from the analysis root directory, you’re going to get results like you’ve experienced.
Hi,
we have disable the SCM Sensor in the Sonar Cloud but we still facing the issue and i am attaching the snapshot of Jenkins file in which we analyzing the code for PR,