Test Execution Results - Is it possible for the Quality Gate to Include Test Pass Percentage?

Must-share information (formatted with Markdown):

  • which versions are you using (SonarQube, Scanner, Plugin, and any relevant extension)
  • SonarQube - Community Edition - Version 9.3 (build 51899)
  • @casualbot/jest-sonar-reporter”: “^2.2.5”
  • “sonarqube-scanner”: “^2.8.1”

Tried so far:

In the documentation, there is a section for uploading test execution data using the Generic Test Execution Report Format. I have a file which the scanner generated that looks like this (Some information redacted with …):

<testExecutions version="1">
 <file path="src/__test__/redux/reducer.test.js">
  <testCase name="STEP returns the initial state of step" duration="3"/>
  <testCase name="STEP returns the current state of step" duration="0"/>
  <testCase name="STEP returns the updated state of step" duration="0"/>
  <testCase name="FETCH_VIEW_SETTINGS returns the initial state" duration="0"/>
  <testCase name="FETCH_VIEW_SETTINGS returns the current state" duration="1"/>
  <testCase name="FETCH_COMPANY_DETAILS returns the initial state" duration="0"/>
  <testCase name="FETCH_COMPANY_DETAILS returns the current state" duration="1"/>
  <testCase name="FETCH_SCHEDULING_POLICY returns the initial state" duration="0"/>
  <testCase name="FETCH_SCHEDULING_POLICY returns the current state" duration="1"/>
...
...
  <testCase name="FETCH_CLASS_INVENTORY returns the existing state" duration="3">
   <failure message="Error: expect(received).toBe(expected) // Object.is equality"><![CDATA[Error: expect(received).toBe(expected) // Object.is equality

Expected: 2
Received: 3
    at Object.<anonymous>
    <REDACTED>
</failure>
  </testCase>
...

In the CI logs, I can see the file with the test execution data is being parsed:

INFO: Sensor Generic Test Executions Report
  INFO: Parsing /home/runner/work/proj/proj/executions/test-report.xml
  INFO: Imported test execution data for 121 files
  INFO: Sensor Generic Test Executions Report (done) | time=85ms

The report is generated thanks to the updated fork of jest-sonar-reporter, @casualbot/jest-sonar-reporter, and it’s configured in package.json like so:

"reporters": [
      "default",
      [
        "jest-html-reporters",
        {
          "publicPath": "./jest-client-side-report",
          "pageTitle": "Client Side Unit Tests",
          "filename": "index.html"
        }
      ],
      [
        "@casualbot/jest-sonar-reporter",
        {
          "relativePaths": true,
          "outputName": "test-report.xml",
          "outputDirectory": "executions"
        }
      ]
    ],

From what I can tell, I have all of the pieces necessary in place to include test execution data, but I’m lacking information about what exactly this means. I don’t see anything in the SonarQube Community Edition dashboard related to test executions. So here are my questions:

Trying to achieve

I want to analyze the test results and either pass or fail the SonarQube Quality Gate depending on what percentage of the unit tests pass. If 90% pass, then we pass the quality gate and deploy the build. If less than 90% pass, then we fail the quality gate.

Does SonarQube support this? What exactly does SonarQube do with the test execution data? Where is it in the dashboard?

Let me clarify that I am not referring to test coverage. We have this in place and require 80% test coverage, but I also want to focus on the percentage of tests that pass. My understanding is that I can have 80% of the code covered by tests, but when executed, 50% of the tests pass. From my understanding, code coverage and the test results are two completely separate metrics, and I’d like to get official clarity on that if possible.

Thank you!
James
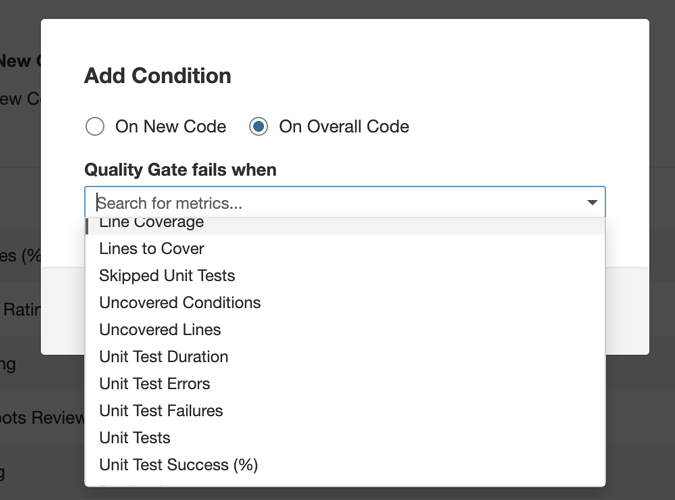
Hey there.

If test execution details are imported correctly, you’ll see a count of Unit Tests under the Overall Code tab of your project (next to code coverage) as well as in the Measures tab of your project (under Coverage).

You can adjust Quality Gate metrics related to tests by adding a metric on Overall Code.

And… I would be interested in understanding your use-case for running SonarQube analysis without your tests passing.

To be honest, test execution details in SonarQube is always a candidate for deprecation/removal because… it’s rare that a build pipeline will get as far as SonarQube analysis if tests are failing – and allowing things like coverage reports to reach SonarQube that represent failing tests would misrepresent the “true” coverage of the project.

Hi Colin,

Thank you for the response. I want to refer to the “Clean As You Code” section in the SonarQube documentation. https://docs.sonarqube.org/latest/user-guide/clean-as-you-code/. This explains the logic behind having a quality gate, which is that many software projects with legacy code will get flooded with tons of issues the first time they run a SonarQube analysis. To avoid overwhelming the team with this torrential windfall of issues, the goal of the Quality Gate, according to “Clean as you code”, is to put the focus on the new code to “stop the leak” and put more emphasis on writing clean code.

What SonarQube accomplished with the Quality Gate concept is the idea that you’re drawing a line in the sand and saying, “This is the standard we expect, going forward”.

Now, let’s talk about unit tests. You can imagine that a team with a lot of code quality issues may be deficient in other areas as well, such as writing good, maintainable unit tests. Despite the logic that tests are a good thing and that they should always pass, some teams let the tests rot for a variety of different reasons. Fixing them, especially after a long period of time, may be a time-consuming process, since people may not even remember what exactly changed to break them in the first place.

So, inspired by the “Clean as you code” concept, one idea we had was to include unit test results in the quality gate so that we can bring more transparency to the fact that tests are broken, and so that we can set targets for improving the tests, making them more maintainable, and getting them to pass.

For example, let’s say we have 60% of the tests passing. To draw the line in the sand, we would set the pass percentage in the quality gate to 60%. From this point forward, the pipeline will fail if the tests drop below 60% passing.

We can also then increase the targets. For example, in 30 days, we expect 75% of the tests to pass and at 60 days 90%. At 90 days, we should then hopefully be in a position to say 100% of the tests must pass in order to deploy. From this point forward, we then redraw the line in the sand to say that all tests, all 100% of them, must pass in order to deploy.

Having the ability to set a target for unit test pass percentage allows us to start using pipelines, creates transparency, and allows us to measure results and improve the tests over time. Currently, we can’t really run tests in the pipeline because so many are failing, so some teams either skip running the tests altogether, or bypass it by manually deploying.

I get what you’re saying though. In a perfect world the unit tests would just pass 100% or we don’t deploy, but some teams and codebases would benefit from the ability to ease into correcting these defects, just like how it works for other categories that SonarQube analyzes and reports on.

If SonarQube can’t do this, or if this is still on the deprecation list, then our alternative is to create a GitHub Action that acts as a unit testing quality gate by measuring the results of running Jest tests. Using “continue-on-error”, we allow the workflow to continue executing when tests fail and instead let the unit test quality gate decide what to do next. If the percent passing is below a certain threshold, then we fail the pipeline; otherwise, we deploy. Before working on this further, I wanted to make sure we weren’t reinventing the wheel, and that this wasn’t something SonarQube could already do for us.

Hope this helps clarify! Please do let me know if you need any other information about this use case.

James