Just as the title implies we’re dealing with an “issue” regarding the information shown in SonarQube for our Ruby Code Coverage when we compare it to the Gitlab Pipeline job execution given that in the Pipe execution it’s showing
Which is weird given that they are both supposedly taking reading the same report
We’re using SimpleCov 0.21.1 and only made some minor adjustment to the report in order to avoid using the “branches” feature that came after simplecov 0.18+.
Maybe those are 2 different values and not related at all and I’m getting it all wrong? Any help or guidance would be greatly appreciated :’)
Thanks a lot in advance and happy new year in advance :D!
There are a couple of reasons coverage metrics in SonarQube can be different to raw coverage provided by coverage tools:
SonarQube’s coverage metric uses a combination of line coverage and condition coverage (details here). A quick check of SimpleCov suggests that it only uses line coverage
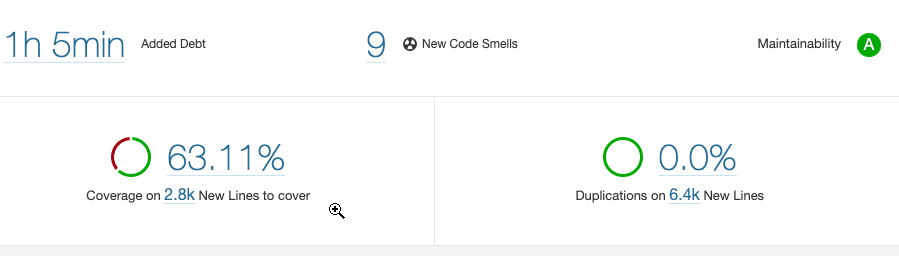
SonarQube uses the Executable Lines metric to take into account lines from files that don’t appear in the coverage report at all (see the blog post here). You can see this in the 1991 LOC shown by SimpleCov vs. the 2.8k New Lines to cover metric shown in your SonarQube screen shot
I hope this clarifies; let me know if you have more questions.