Sonarqube installed version is Enterprise Edition Version 7.9.3.
Our Sonarqube application stopped suddenly yesterday and not sure what was the problem also noticed that “This is very likely to create a memory leak” in the web.log file.
Please do the needful to findout the root cause and solution.
Log message:
2021.01.03 13:30:00 WARN web[o.a.c.l.WebappClassLoaderBase] The web application [ROOT] appears to have started a thread named [logback-13] but has failed to stop it. This is very likely to create a memory leak. Stack trace of thread:
java.base@11.0.7/jdk.internal.misc.Unsafe.park(Native Method)
java.base@11.0.7/java.util.concurrent.locks.LockSupport.park(LockSupport.java:194)
java.base@11.0.7/java.util.concurrent.locks.AbstractQueuedSynchronizer$ConditionObject.await(AbstractQueuedSynchronizer.java:2081)
java.base@11.0.7/java.util.concurrent.ScheduledThreadPoolExecutor$DelayedWorkQueue.take(ScheduledThreadPoolExecutor.java:1170)
java.base@11.0.7/java.util.concurrent.ScheduledThreadPoolExecutor$DelayedWorkQueue.take(ScheduledThreadPoolExecutor.java:899)
java.base@11.0.7/java.util.concurrent.ThreadPoolExecutor.getTask(ThreadPoolExecutor.java:1054)
java.base@11.0.7/java.util.concurrent.ThreadPoolExecutor.runWorker(ThreadPoolExecutor.java:1114)
java.base@11.0.7/java.util.concurrent.ThreadPoolExecutor$Worker.run(ThreadPoolExecutor.java:628)
java.base@11.0.7/java.lang.Thread.run(Thread.java:834)
2021.01.03 13:30:00 WARN web[o.a.c.l.WebappClassLoaderBase] The web application [ROOT] appears to have started a thread named [logback-15] but has failed to stop it. This is very likely to create a memory leak. Stack trace of thread:
java.base@11.0.7/jdk.internal.misc.Unsafe.park(Native Method)
java.base@11.0.7/java.util.concurrent.locks.LockSupport.park(LockSupport.java:194)
java.base@11.0.7/java.util.concurrent.locks.AbstractQueuedSynchronizer$ConditionObject.await(AbstractQueuedSynchronizer.java:2081)
java.base@11.0.7/java.util.concurrent.ScheduledThreadPoolExecutor$DelayedWorkQueue.take(ScheduledThreadPoolExecutor.java:1170)
java.base@11.0.7/java.util.concurrent.ScheduledThreadPoolExecutor$DelayedWorkQueue.take(ScheduledThreadPoolExecutor.java:899)
java.base@11.0.7/java.util.concurrent.ThreadPoolExecutor.getTask(ThreadPoolExecutor.java:1054)
java.base@11.0.7/java.util.concurrent.ThreadPoolExecutor.runWorker(ThreadPoolExecutor.java:1114)
java.base@11.0.7/java.util.concurrent.ThreadPoolExecutor$Worker.run(ThreadPoolExecutor.java:628)
java.base@11.0.7/java.lang.Thread.run(Thread.java:834)
2021.01.03 13:30:00 DEBUG web[o.s.s.a.TomcatAccessLog] Tomcat is stopped
please find some other error message which was occurred .
Sonar.log
WARNING: All illegal access operations will be denied in a future release
2020.06.25 16:48:50 DEBUG app[][o.e.c.t.TransportClientNodesService] failed to connect to node [{#transport#-1}{d5ts0W89R4irM_X9UZVfrw}{xxxxxxxx}{172.1xxxxxxxx:9001}], ignoring...
org.elasticsearch.transport.ConnectTransportException: [][1xxxxxxxxx:9001] connect_exception
	at org.elasticsearch.transport.TcpTransport$ChannelsConnectedListener.onFailure(TcpTransport.java:1309)
ce.log
021.01.03 13:27:27 DEBUG ce[][o.p.c.v.ConnectionFactoryImpl] Trying to establish a protocol version 3 connection to sonarqube-database-v00.xxxxxxx.eu-central-1.rds.amazonaws.com:5432
2021.01.03 13:27:27 DEBUG ce[][o.p.ssl.MakeSSL] converting regular socket connection to ssl
2021.01.03 13:27:27 DEBUG ce[][o.p.c.v.ConnectionFactoryImpl] Receive Buffer Size is 65,536
2021.01.03 13:27:27 DEBUG ce[][o.p.c.v.ConnectionFactoryImpl] Send Buffer Size is 43,520
Web.log
2021.01.03 13:30:00 WARN  web[][o.a.c.l.WebappClassLoaderBase] The web application [ROOT] appears to have started a thread named [logback-15] but has failed to stop it. This is very likely to create a memory leak. Stack trace of thread:
 java.base@11.0.7/jdk.internal.misc.Unsafe.park(Native Method)
 java.base@11.0.7/java.util.concurrent.locks.LockSupport.park(LockSupport.java:194)
 java.base@11.0.7/java.util.concurrent.locks.AbstractQueuedSynchronizer$ConditionObject.await(AbstractQueuedSynchronizer.java:2081)
 java.base@11.0.7/java.util.concurrent.ScheduledThreadPoolExecutor$DelayedWorkQueue.take(ScheduledThreadPoolExecutor.java:1170)
 java.base@11.0.7/java.util.concurrent.ScheduledThreadPoolExecutor$DelayedWorkQueue.take(ScheduledThreadPoolExecutor.java:899)
 java.base@11.0.7/java.util.concurrent.ThreadPoolExecutor.getTask(ThreadPoolExecutor.java:1054)
 java.base@11.0.7/java.util.concurrent.ThreadPoolExecutor.runWorker(ThreadPoolExecutor.java:1114)
 java.base@11.0.7/java.util.concurrent.ThreadPoolExecutor$Worker.run(ThreadPoolExecutor.java:628)
 java.base@11.0.7/java.lang.Thread.run(Thread.java:834)
2021.01.03 13:30:00 DEBUG web[][o.s.s.a.TomcatAccessLog] Tomcat is stopped
2020.06.25 16:04:34 DEBUG app[][o.e.c.t.TransportClientNodesService] failed to connect to node [{#transport#-1}{nl-OgQJATMaC0vIGemUTxg}{xxxxxxxx.201}{xxxxxxx:9001}], ignoring...
org.elasticsearch.transport.ConnectTransportException: [][xxxxxxxxx:9001] connect_exception
	at org.elasticsearch.transport.TcpTransport$ChannelsConnectedListener.onFailure(TcpTransport.java:1309)
	at org.elasticsearch.action.ActionListener.lambda$toBiConsumer$2(ActionListener.java:100)
	at org.elasticsearch.common.concurrent.CompletableContext.lambda$addListener$0(CompletableContext.java:42)
	at java.base/java.util.concurrent.CompletableFuture.uniWhenComplete(CompletableFuture.java:859)
	at java.base/java.util.concurrent.CompletableFuture$UniWhenComplete.tryFire(CompletableFuture.java:837)
	at java.base/java.util.concurrent.CompletableFuture.postComplete(CompletableFuture.java:506)
	at java.base/java.util.concurrent.CompletableFuture.completeExceptionally(CompletableFuture.java:2088)
	at org.elasticsearch.common.concurrent.CompletableContext.completeExceptionally(CompletableContext.java:57)
	at org.elasticsearch.transport.netty4.Netty4TcpChannel.lambda$new$1(Netty4TcpChannel.java:72)
	at io.netty.util.concurrent.DefaultPromise.notifyListener0(DefaultPromise.java:511)
	at io.netty.util.concurrent.DefaultPromise.notifyListeners0(DefaultPromise.java:504)
	at io.netty.util.concurrent.DefaultPromise.notifyListenersNow(DefaultPromise.java:483)
	at io.netty.util.concurrent.DefaultPromise.notifyListeners(DefaultPromise.java:424)
	at io.netty.util.concurrent.DefaultPromise.tryFailure(DefaultPromise.java:121)
	at io.netty.channel.nio.AbstractNioChannel$AbstractNioUnsafe.fulfillConnectPromise(AbstractNioChannel.java:327)
	at io.netty.channel.nio.AbstractNioChannel$AbstractNioUnsafe.finishConnect(AbstractNioChannel.java:343)
	at io.netty.channel.nio.NioEventLoop.processSelectedKey(NioEventLoop.java:644)
	at io.netty.channel.nio.NioEventLoop.processSelectedKeysOptimized(NioEventLoop.java:591)
	at io.netty.channel.nio.NioEventLoop.processSelectedKeys(NioEventLoop.java:508)
	at io.netty.channel.nio.NioEventLoop.run(NioEventLoop.java:470)
	at io.netty.util.concurrent.SingleThreadEventExecutor$5.run(SingleThreadEventExecutor.java:909)
	at java.base/java.lang.Thread.run(Thread.java:834)
Caused by: io.netty.channel.AbstractChannel$AnnotatedConnectException: Connection refused: /172.16.73.201:9001
	at java.base/sun.nio.ch.SocketChannelImpl.checkConnect(Native Method)
	at java.base/sun.nio.ch.SocketChannelImpl.finishConnect(SocketChannelImpl.java:779)
	at io.netty.channel.socket.nio.NioSocketChannel.doFinishConnect(NioSocketChannel.java:327)
	at io.netty.channel.nio.AbstractNioChannel$AbstractNioUnsafe.finishConnect(AbstractNioChannel.java:340)
	... 6 common frames omitted
Caused by: java.net.ConnectException: Connection refused
	... 10 common frames omitted
2020.06.25 16:04:35 WARN  app[][o.s.a.p.AbstractManagedProcess] Process exited with exit value [es]: 143
2020.06.25 16:04:35 INFO  app[][o.s.a.SchedulerImpl] Process[es] is stopped
2020.06.25 16:04:35 INFO  app[][o.s.a.SchedulerImpl] SonarQube is stopped
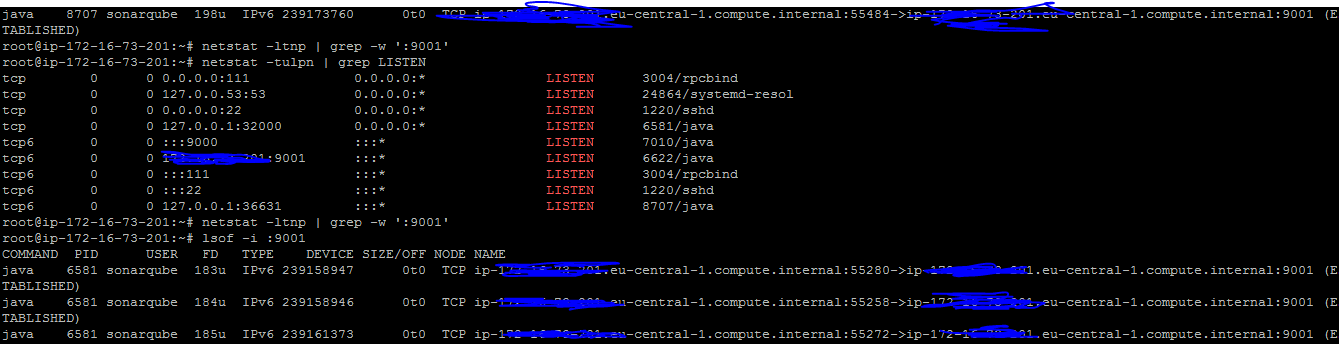
Hi, so it looks like that the tcp port 9001 is already busy. It’s used by SonarQube to start an elasticsearch process. Make sure you free this 9001 port before starting, or edit your sonar.properties to force the usage of another free port.
Starting SQ in Enterprise Edition means starting 3 processes:
a web process, that handles the API & the web UI
a Compute Engine process that process analysis reports
an ElasticSearch process that store denormalised data for fast access
All 3 process needs to talks to each other to collaborate, through APIs or the filesystem. The ElasticSearch process exposes it’s API to the TCP port 9001. The web and Compute Engine access ElasticSearch by calling localhost:9001. So you need a free port for ES to expose its API.
SonarQube can’t work without ElasticSearch working properly.
See, the Application has worked fine earlier and stopped suddenly in between. I couldn’t find the reason why it was stopped suddenly. However, In the sonar.log file captured to “create a memory leak” error message.
could you please help me to resolve this issue?
Log message:
Sonar.log
2021.01.03 13:30:00 WARN web[o.a.c.l.WebappClassLoaderBase] The web application [ROOT] appears to have started a thread named [logback-13] but has failed to stop it. This is very likely to create a memory leak. Stack trace of thread:
java.base@11.0.7/jdk.internal.misc.Unsafe.park(Native Method)
Another application running on the same machine.
No, We didn’t run another application on the same machine.
Another SonarQube instance running on the same machine
No, It’s a dedicated production instance.
Your existing SQ instance failed to shut down properly and you have a zombie process still running on port 9001.
The application running for more than 3 months without issue. But applications is stopped suddenly as unknow behavior.
We hosted the Sonarqube application on AWS environment as m4.xlarge instance type and the total number of projects is195 around.
Are there any hardware-recommendations to improve the application performance, because nowadays applications took more response time to react?
DEBUG es[o.e.i.s.IndexShard] state: [STARTED]->[CLOSED], reason [shutdown]
2021.01.13 13:29:47 DEBUG es[o.e.i.e.Engine] flushing shard on close - this might take some time to sync files to disk
2021.01.13 13:29:47 DEBUG es[o.e.i.e.Engine] close now acquiring writeLock
2021.01.13 13:29:47 DEBUG es[o.e.i.e.Engine] close acquired writeLock
2021.01.13 13:29:47 DEBUG es[o.e.i.t.Translog] translog closed
2021.01.13 13:29:47 DEBUG es[o.e.i.IndexService] [0] closing… (reason: [shutdown])