I currently have pipelines set up via SonarCloud. I have set up my VS code with my org key and my personal token. I have set up my workspace settings for a specific project using the project key in SonarCloud. However, SonarLint only shows me warnings for minor issues and not major security issues. For example, the project on SonarCloud shows 3 hotspot issues to investigate. However, on my VScode on the same file, I see no highlights or indications of an issue.
Any ideas of what is going on? I would like to enable SonarCloud as a hard gate but before I do that I need to SonarLint to inform developers of issues before they push code to the pipeline.
Please ignore that it’s a test file. I know it’s recommended practice to ignore test files.
In the Sonar solution, Security Hotspots are special beasts: we consider them as findings that need to be checked by a human being, whereas for other types of issues (bugs, code smells and vulnerabilities), we are usually pretty sure that something should be fixed.
This is why until recently, SonarLint did not report them locally: we don’t want to mix security hotspots with the rest of the issues in the “Problems” view, it would be too noisy (and potentially hide real issues).
With version 3.14 of SonarLint for VSCode, we enabled the local detection of security hotspots when used in connected mode with SonarQube 9.7+; unfortunately, SonarCloud’s Web API currently lacks some of the fields that SonarLint relies on to track security hotspots, so this feature is not available yet in connected mode with SonarCloud.
You can follow this roadmap card to be notified when the feature will be available in connected mode for SonarCloud. It is part of our short-term priorities.
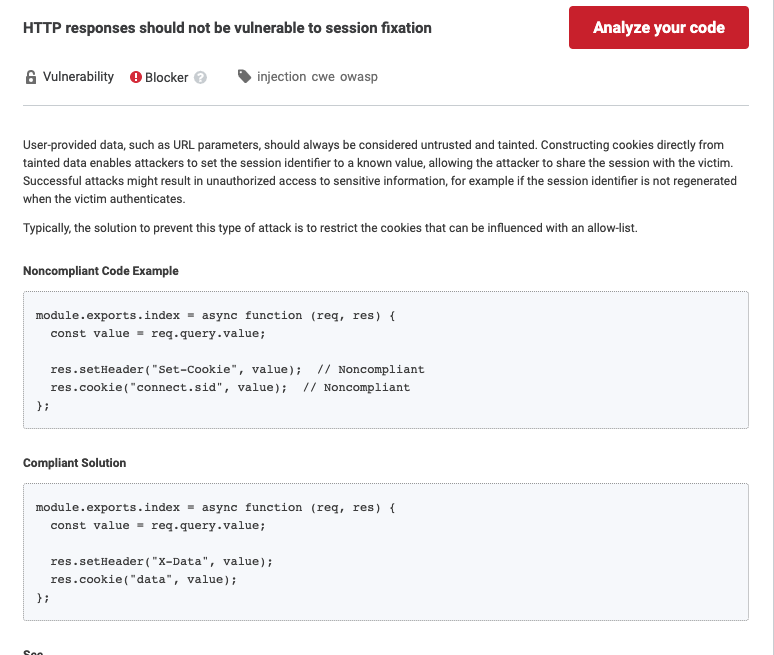
I have copied over the noncompliant example and put in my code. I watched the output tab to see if it analyzed my file with the noncompliant code but it doesn’t show any kind of error. The highlights in the code you see from the images below are from my eslint.
As per the FAQ, taint vulnerabilities (such as the one you mentioned) are not detected in SonarLint either: they rely on a taint analysis engine that is currently not compatible with the level of performance we want to achieve in SonarLint.
This being said, if the code is analyzed on SonarCloud, taint vulnerabilities detected by the server should be highlighted in the local code, provided that SonarLint can still find the location.
As of today, October 4, 2023, do you know if there have been any advancements in the integration between SonarLint (for Visual Studio 2022) and SonarCloud? We are still experiencing significant differences between what is reported on the SonarCloud dashboard and what is listed in Visual Studio. Even when running code analysis, there is a percentage of results that do not appear. It would also be extremely helpful if SonarLint could highlight the values of the highest cognitive complexity points in the code editor.
We are also looking forward to the SonarLint plugin for VSCode becoming more mature. When can we expect a more comprehensive version of SonarLint? For example, one that allows us to list all issues in an error window so that we can select the problem we want to address directly.