Only if the SonarCloud project is public, the URL : Private
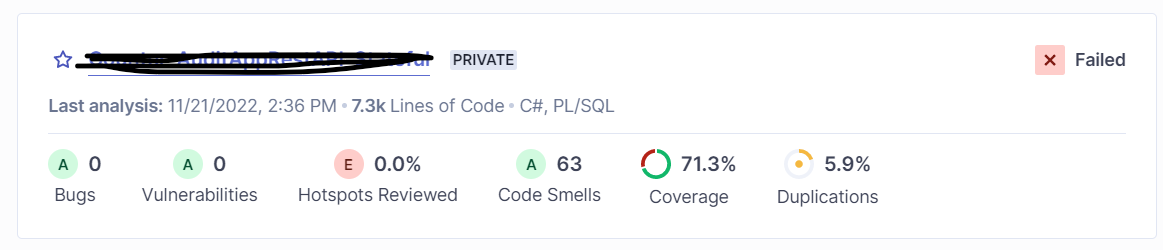
Error observed: 0 vulnerabilities in sonar cloud project
Our organization uses sonar cloud paid plan for static code analysis. We setup sonar integration using Azure Devops for the project but we don’t see any vulnerabilities detected within the project (the project do have vulnerabilities and has been detected by other security resource within the organization). Not sure what needs to be configured here additionally.
FYI we exposed SQL database connection string (password/username) within the repo which I believe is a vulnerability which sonar should detect but it is not working as expected.
Vulnerability comes from the sonar default way rules I don’t see anything that’s need to be added manually.
@Colin This is the code which I used to reproduce the issue in my project:
using Microsoft.AspNetCore.Mvc;
using System;
using System.Collections.Generic;
using System.Linq;
using System.Threading.Tasks;

namespace Counter_AuditAppRestAPI_Stateless.Controllers
{
    public class HomeController: Controller
    {
        public IActionResult RedirectMe(string url)
    {
        return Redirect(url);
    }

    public IActionResult SetLocationHeader(string url)
    {
        Response.Headers["Location"] = url; // Noncompliant
        return StatusCode(302);
    }
    }
}
I am not able to reproduce this, for me, the code raises the vulnerability. Can you tell us more about how you perform the scan? .NET analysis requires hooking the build process, maybe that step is incomplete and no proper analysis is performed.
Maybe you can share the logs of a scan, that would be quite helpful.
We would need your help to be able to investigate further what the problem is.
Could you please provide us with the content of the .sonarqube\out\ucfg_cs2 folder?
We have seen the logs you have provided and based on that we would like to ask you to provide us with the content of the .sonarqube\out\ucfg_cs2 folder if possible.
@Caba_Sagi Could you please let me know where can I find .sonarqube\out\ucfg_cs2 folder? Is it the logs from Run code analysis step from the azure devops pipeline?
We have had a bit of time today to look at your problem and it seems we have found what the problem is.
Looking at the .yml file of your pipeline configuration you are doing a dotnet build and a dotnet test right one after the other. Without adding the –no-build option to dotnet test you will build your project twice (and run the analysis twice) which will report all the issues twice and our engine gets confused and will throw away both findings. My colleagues are going to fix this behaviour of the engine in the future.
As an immediate workaround, you can add the –no-build option to the dotnet test command and it should fix the problem for you. Additionally, it will also decrease the execution time of your pipeline as it will not run the analysis twice.