I’m having some performance issues with sonarcloud analysis taking a long time to complete. At the moment analysis is taking just over 17 minutes to complete.
Details about project and ALM.
The project is ASP .Net with 1048 javascript files (note I have inherited this application)
ALM is Azure DevOps and we are using the Sonarcloud extension for Azure DevOps to complete the build and analysis via Azure pipelines Sonarcloud extension for Azure Devops
What I have tried.
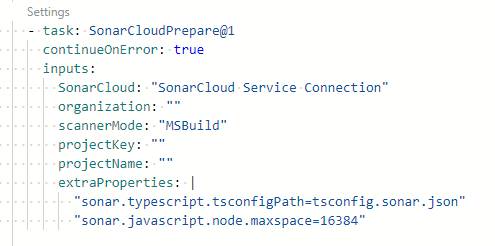
I found this post in the Sonar community SonarCloud scan is taking a very long time and as such I have added a tsconfig.sonar.json file and used the extraProperties property to set the location of the file. I also had to set sonar.javascript.node.maxspace setting as I ran into an out of memory exception.
As a result of my changes I have decreased the time for the analysis step from 23 minutes down to 17 mins but this still taking a lot longer than any other project we scan using Sonarcloud. I have included some screen shots of the Azure DevOps extension configuration and also of the tsconfig file.
Does anyone have any suggestions as to why this is taking so long?
I’m facing some performance challenges with the SonarCloud analysis, which is taking an extended period to complete. Currently, the analysis process is consuming over 17 minutes to finish.
Here are some key details about the project and our ALM setup:
Project: ASP .Net with 1048 JavaScript files.
ALM: We’re using Azure DevOps, and the SonarCloud extension for Azure DevOps facilitates the build and analysis through Azure pipelines.
In an attempt to optimize the analysis time, I’ve implemented the following adjustments:
extraProperties: |
“sonar.typescript.tsconfigPath=tsconfig.sonar.json”
“sonar.javascript.node.maxspace=16384”
“sonar.analysis.mode=incremental”
“sonar.coverage.exclusions=**/*.config”
“sonar.verbose=true”
“sonar.log.level=DEBUG”
Interestingly, the background tasks duration displayed on the SonarCloud UI indicates a significantly shorter duration, approximately between 3.1 to 4.496 minutes, in contrast to the longer time observed, almost 28 minutes, for analysis shown in the pipeline.
The analysis / scanner log is what’s output from the analysis command. Hopefully, the log you provide - redacted as necessary - will include that command as well.