Since June 16th, our project on SonarCloud has stopped analyzing pull requests correctly. We didn’t make any changes to our configuration, but:
The last successful job was on June 16.
After that, SonarCloud stopped running automatic analyses on PRs.
We switched to GitHub Actions to troubleshoot it, but the scanner gets stuck during JavaScript security analysis.
The analysis log always freezes around here:
21:09:15.933 INFO Sensor JsSecuritySensorV2 [jasmin]
21:09:16.012 INFO 3194 file(s) will be analysed by SonarJasmin.
21:09:44.890 INFO Analysis progress: 7% (250/3194 files)
...
21:27:21.239 ERROR isAlive was interrupted
java.lang.InterruptedException
at org.sonar.plugins.javascript.bridge.BridgeServerImpl.isAlive
This seems to indicate a problem with the internal bridge used by the JS security scanner, which eventually fails due to timeout or a deadlock.
We tried increasing heap memory to 4 GB (-Xmx4096m), but the issue persists.
At the same time, our automatic branch analysis (without GitHub Actions) also fails. For example:
Last analysis failed
Analysis ID: AZeEDWZNjyv49g5IfJVi
Your analysis with ID AZeEDWZNjyv49g5IfJVi has failed: An error has occurred with your code repository platform (GitHub, Bitbucket, Azure DevOps, or GitLab). Please try again.
We’d appreciate any help or guidance on:
Fixing or bypassing the JS security scan issue (e.g., known bug, workaround, fix ETA)
Getting automatic analysis working again without GitHub Actions
thank you for this report, and welcome to the community!
Your problem seems to be caused by the new JS security engine that we recently rolled out.
I would be very grateful if you could provide us with debug logs of you analysis so we can investigate and fix this issue. Could you run the scan with -Dsonar.verbose=true and either attach the logs to this thread, or send them to me via PM if you prefer?
Fixing or bypassing the JS security scan issue (e.g., known bug, workaround, fix ETA)
You can bypass the new JS security sensor with the switch -Dsonar.jasmin.internal.disabled=true. This will switch back to the old JS security sensor and hopefully resolve your issue. I would be grateful if you could share the debug logs of your scan before you do this, so we can work on fixing this issue, rather than just working around it!
Getting automatic analysis working again without GitHub Actions
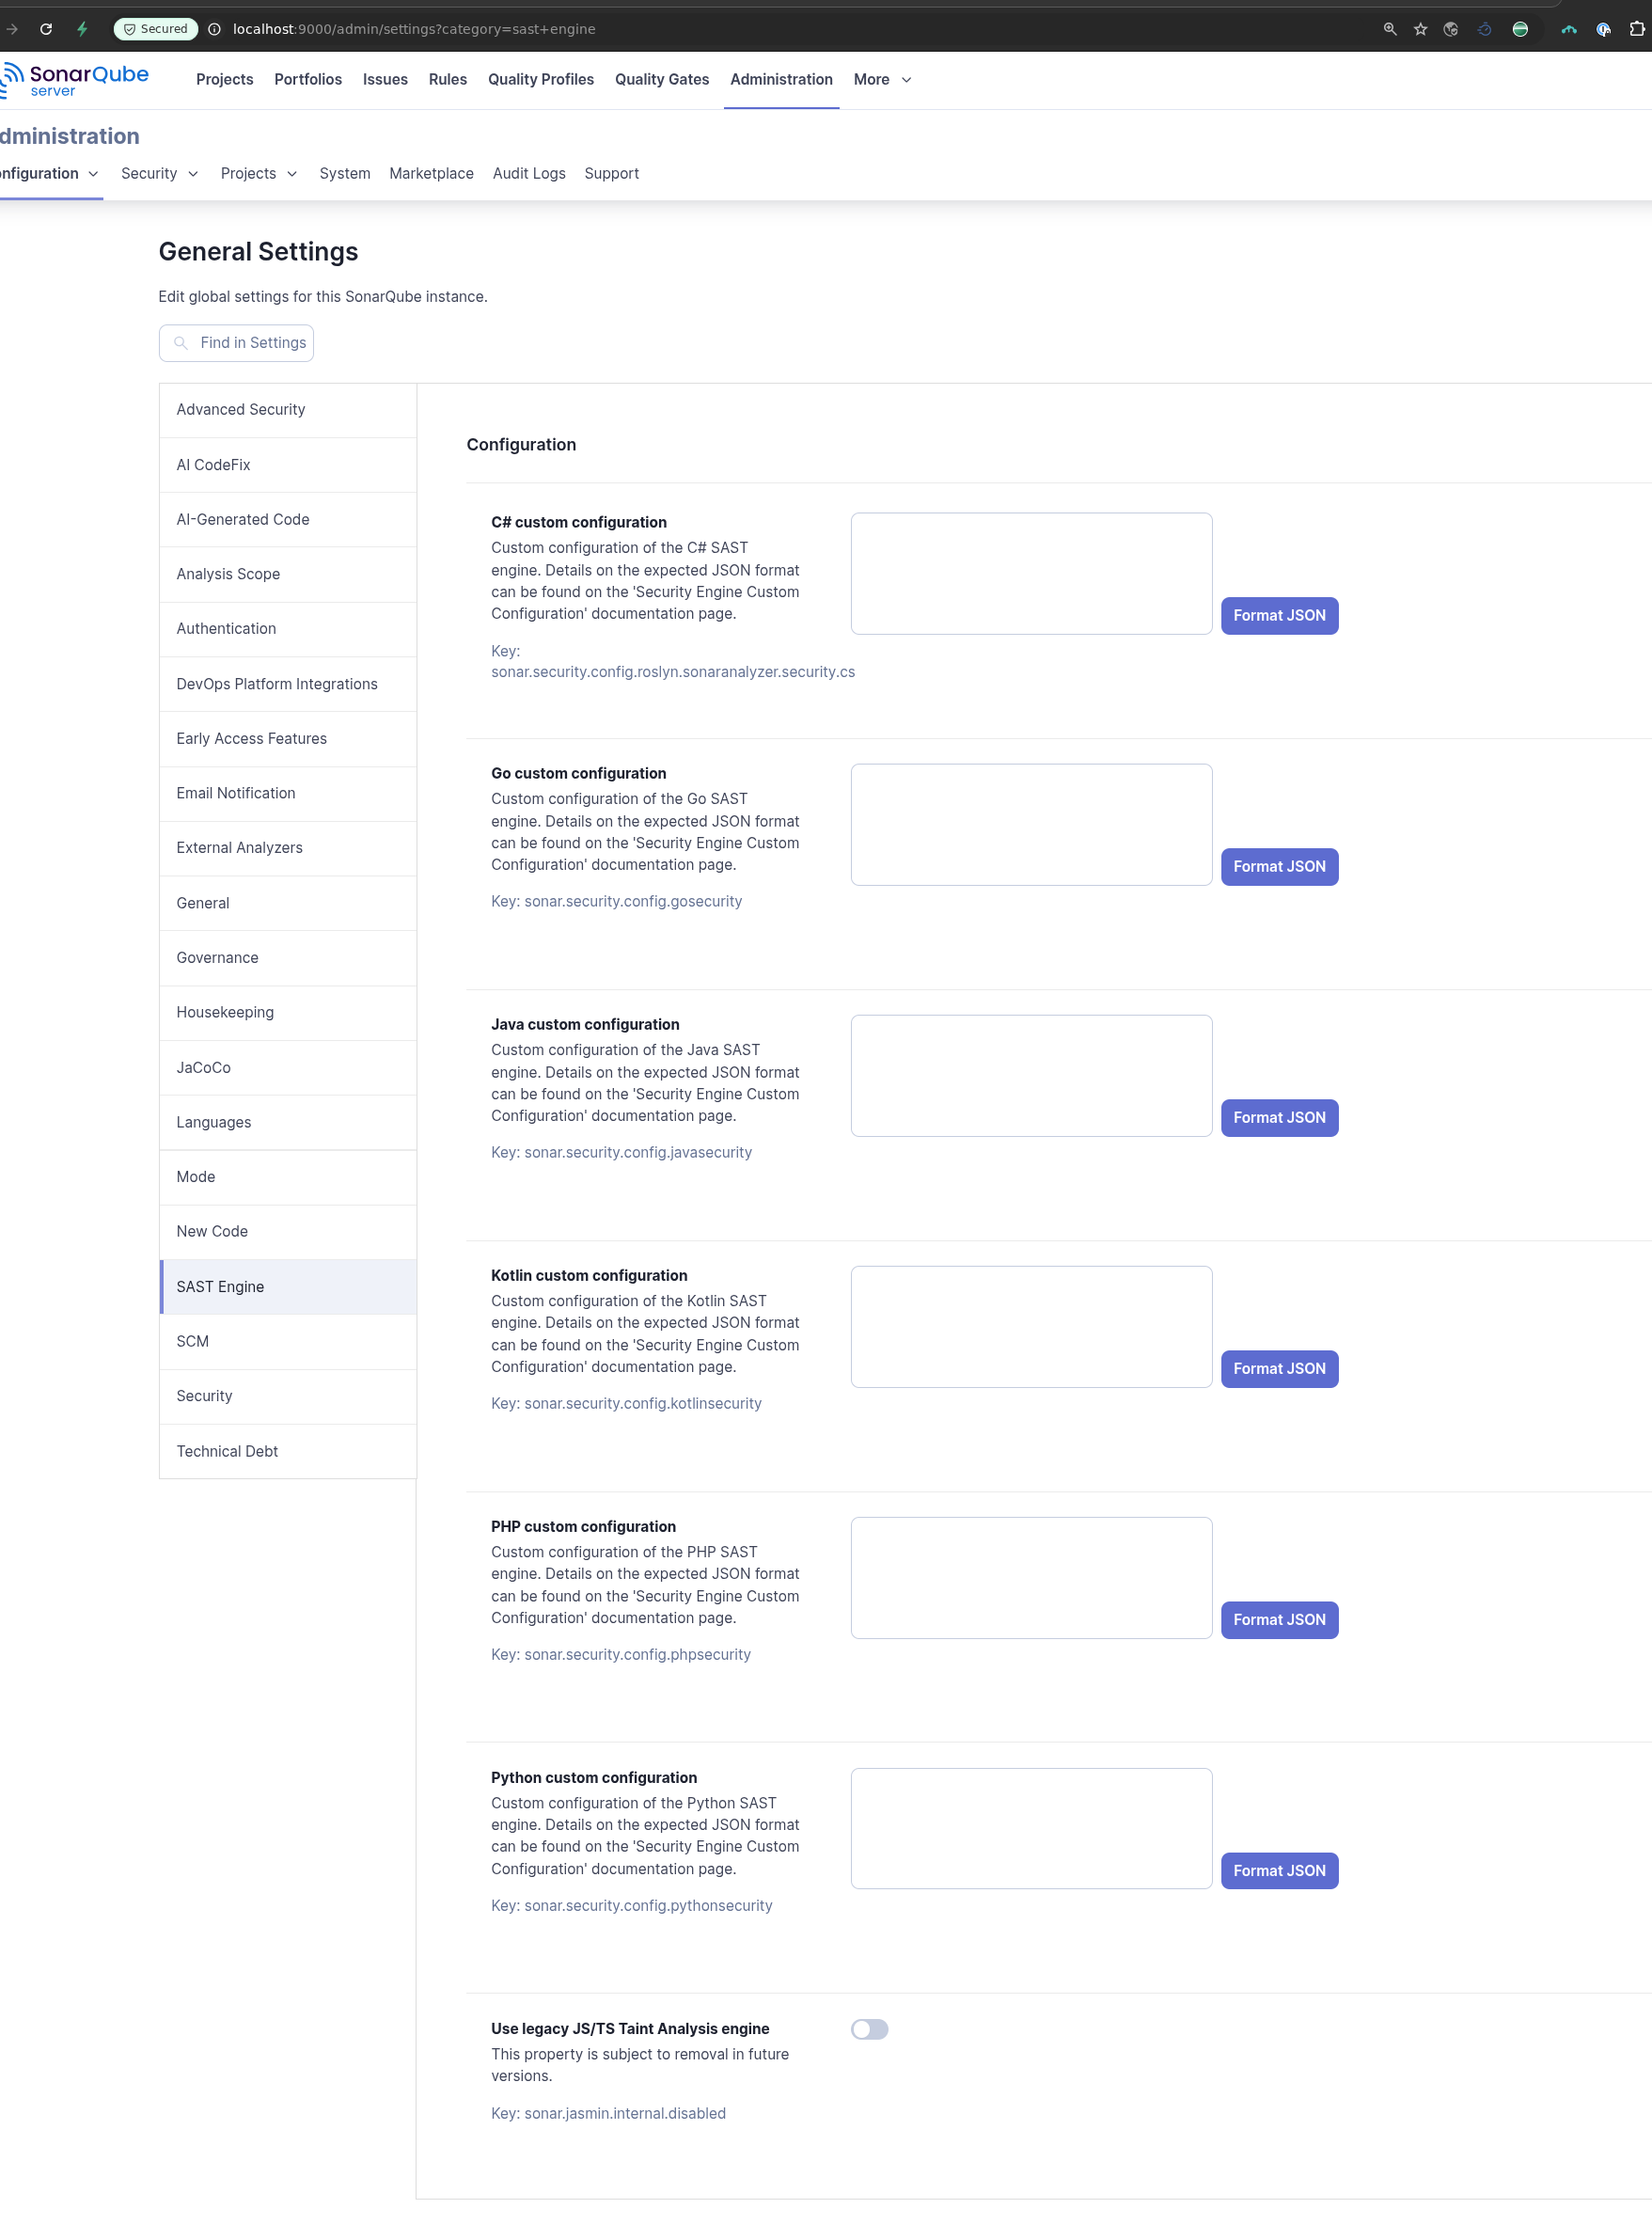
Same thing here, you can switch back to the old analysis with the switch sonar.jasmin.internal.disabled=true. When using automatic analysis, you can also set it in the UI on SonarQube Cloud, see screenshot below (“Use legacy JS/TS Taint Analysis engine”).
I know you can workaround the problem by excluding a specific file as discussed via private message. Here’s a quick status update on the new sensor.
After some investigation following a small reproducer from another user who ran into the same problem here, we identified a bug in the new sensor involving the analysis of promise chains. Does your project use such promise chains? If yes, it is not unlikely that the analysis took longer due to this.
We also implemented another general performance improvement that helps to boost performance in certain situations.
Both of these will be released to SonarQube Cloud within the next 24 hours. I will let you know when this is available and I would appreciate your feedback whether you are seeing a performance improvement.
@MartinLVila As announced yesterday, we released a new version on SQC today that fixes some known issues. Could you try another scan with the new sensor and let me know if your problem is fixed?