I have built our c-sharp solution, and we use dotcover for code coverage
the following is the output generated.
C:\Client\DEV\DEV_3.3.0\TEST> SonarScanner.MSBuild.exe begin /k:"Client-3.3.0" /n:"Client-3.3.0" /v:"2.0" /d:sonar.cs.dotcover.reportsPaths="C:\Client\DEV\DEV_3.3.0\TEST\CoverageReport.html"

SonarScanner for MSBuild 4.4.2
Using the .NET Framework version of the Scanner for MSBuild
Default properties file was found at C:\sonarqube\msbuild\SonarQube.Analysis.xml`
Loading analysis properties from C:\sonarqube\msbuild\SonarQube.Analysis.xml
Pre-processing started.
Preparing working directories...
15:19:13.733  Updating build integration targets...
15:19:13.766  Fetching analysis configuration settings...
15:19:14.075  Provisioning analyzer assemblies for cs...
15:19:14.077  Installing required Roslyn analyzers...
15:19:14.203  Pre-processing succeeded.


C:\Client\DEV\DEV_3.3.0\TEST>
C:\Client\DEV\DEV_3.3.0\TEST>msbuild ..\source\Clientside.sln

.....
.....
.....
300 Warning(s)
0 Error(s)
Time Elapsed 00:03:06.10
Now, as explained in the website sonarqube-dotcover, i ran the dotcover
C:\Client\DEV\DEV_3.3.0\TEST> dotcover analyse /ReportType=HTML /Output="C:\Client\DEV\DEV_3.3.0\TEST\CoverageReport.html" /TargetExecutable="C:\Client\DEV\DEV_3.3.0\3rdparty\NUnit.Console-3.9.0\nunit3-console.exe" /TargetArguments="C:\Client\DEV\DEV_3.3.0\TEST\ClientTest.nunit"
And this is the output after i ran the sonarscanner end operation.
C:\Client\DEV\DEV_3.3.0\TEST>SonarScanner.MSBuild.exe end
SonarScanner for MSBuild 4.4.2
Using the .NET Framework version of the Scanner for MSBuild
Default properties file was found at C:\sonarqube\msbuild\SonarQube.Analysis.xml
Loading analysis properties from C:\sonarqube\msbuild\SonarQube.Analysis.xml
Post-processing started.
.....
SONAR_SCANNER_OPTS is not configured. Setting it to the default value of -Xmx1024m
Calling the SonarQube Scanner...
INFO: Scanner configuration file: C:\sonarqube\msbuild\sonar-scanner-3.2.0.1227\bin\..\conf\sonar-scanner.properties
INFO: Project root configuration file: C:\Client\DEV\DEV_3.3.0\TEST\.sonarqube\out\sonar-project.properties
............
INFO: Sensor SonarJavaXmlFileSensor [java]
INFO: Sensor SonarJavaXmlFileSensor [java] (done) | time=4ms
INFO: Sensor Analyzer for "php.ini" files [php]
INFO: Sensor Analyzer for "php.ini" files [php] (done) | time=3ms
INFO: No SCM system was detected. You can use the 'sonar.scm.provider' property to explicitly specify it.

........
......

INFO: Source encoding: windows-1252, default locale: en_US
INFO: Index files
INFO: 5 files indexed
INFO: Quality profile for cs: Sonar way
INFO: Sensor C# [csharp]
INFO: Importing analysis results from C:\Client\DEV\DEV_3.3.0\TEST\null\output-cs
INFO: Sensor C# [csharp] (done) | time=6ms
INFO: Sensor SonarJavaXmlFileSensor [java]
INFO: Sensor SonarJavaXmlFileSensor [java] (done) | time=0ms
INFO: Sensor Analyzer for "php.ini" files [php]
INFO: Sensor Analyzer for "php.ini" files [php] (done) | time=1ms
INFO: Sensor C# Tests Coverage Report Import [csharp]
INFO: Aggregating the HTML reports from C:\Client\DEV\DEV_3.3.0\TEST\CoverageReport.html
INFO: Parsing the dotCover report C:\Client\DEV\DEV_3.3.0\TEST\CoverageReport\src\1.html
INFO: Parsing the dotCover report C:\Client\DEV\DEV_3.3.0\TEST\CoverageReport\src\10.html
INFO: Parsing the dotCover report C:\Client\DEV\DEV_3.3.0\TEST\CoverageReport\src\100.html
INFO: Parsing the dotCover report C:\Client\DEV\DEV_3.3.0\TEST\CoverageReport\src\101.html
INFO: Parsing the dotCover report C:\Client\DEV\DEV_3.3.0\TEST\CoverageReport\src\102.html
INFO: Parsing the dotCover report C:\Client\DEV\DEV_3.3.0\TEST\CoverageReport\src\103.html
   ......

    .....

INFO: Adding this code coverage report to the cache for later reuse: C:\Client\DEV\DEV_3.3.0\TEST\CoverageReport.html
INFO: ------------------------------------------------------------------------
INFO: EXECUTION FAILURE
INFO: ------------------------------------------------------------------------
**INFO: Total time: 22.134s**
** INFO: Final Memory: 11M/44M**
** INFO: ------------------------------------------------------------------------**
** ERROR: Error during SonarQube Scanner execution**
** ERROR: Line 129 is out of range in the file source/PipeClient.cs (lines: 128)**
** ERROR:**
** The SonarQube Scanner did not complete successfully**
** 15:10:44.674 Creating a summary markdown file…**
** 15:10:44.685 Post-processing failed. Exit code: 1**
C:\Client\DEV\DEV_3.3.0\TEST>
Contents of the ClientTest.nunit file contains paths to various dlls’
And if I run the same commands through jenkins, i get this error :
INFO: Source encoding: UTF-8, default locale: en_US
INFO: ------------------------------------------------------------------------
INFO: EXECUTION FAILURE
INFO: ------------------------------------------------------------------------
INFO: Total time: 14.850s
INFO: Final Memory: 7M/85M
INFO: ------------------------------------------------------------------------
ERROR: Error during SonarQube Scanner execution
ERROR: Unable to load component class org.sonar.scanner.phases.AbstractPhaseExecutor
ERROR: Caused by: Unable to load component class org.sonar.scanner.issue.ignore.scanner.IssueExclusionsLoader
ERROR: Caused by: Dangling meta character '*' near index 0
**/src/main/java/com/dell/customtools/integration/td/proxy/**
^
ERROR:
The SonarQube Scanner did not complete successfully
21:11:25.365  Creating a summary markdown file...
21:11:25.369  Post-processing failed. Exit code: 1
WARN: Unable to locate 'report-task.txt' in the workspace. Did the SonarScanner succedeed?
ERROR: Execution of SonarScanner for MSBuild failed (exit code 1)
Archiving artifacts
Extended Email Publisher is currently disabled in project settings
Finished: FAILURE
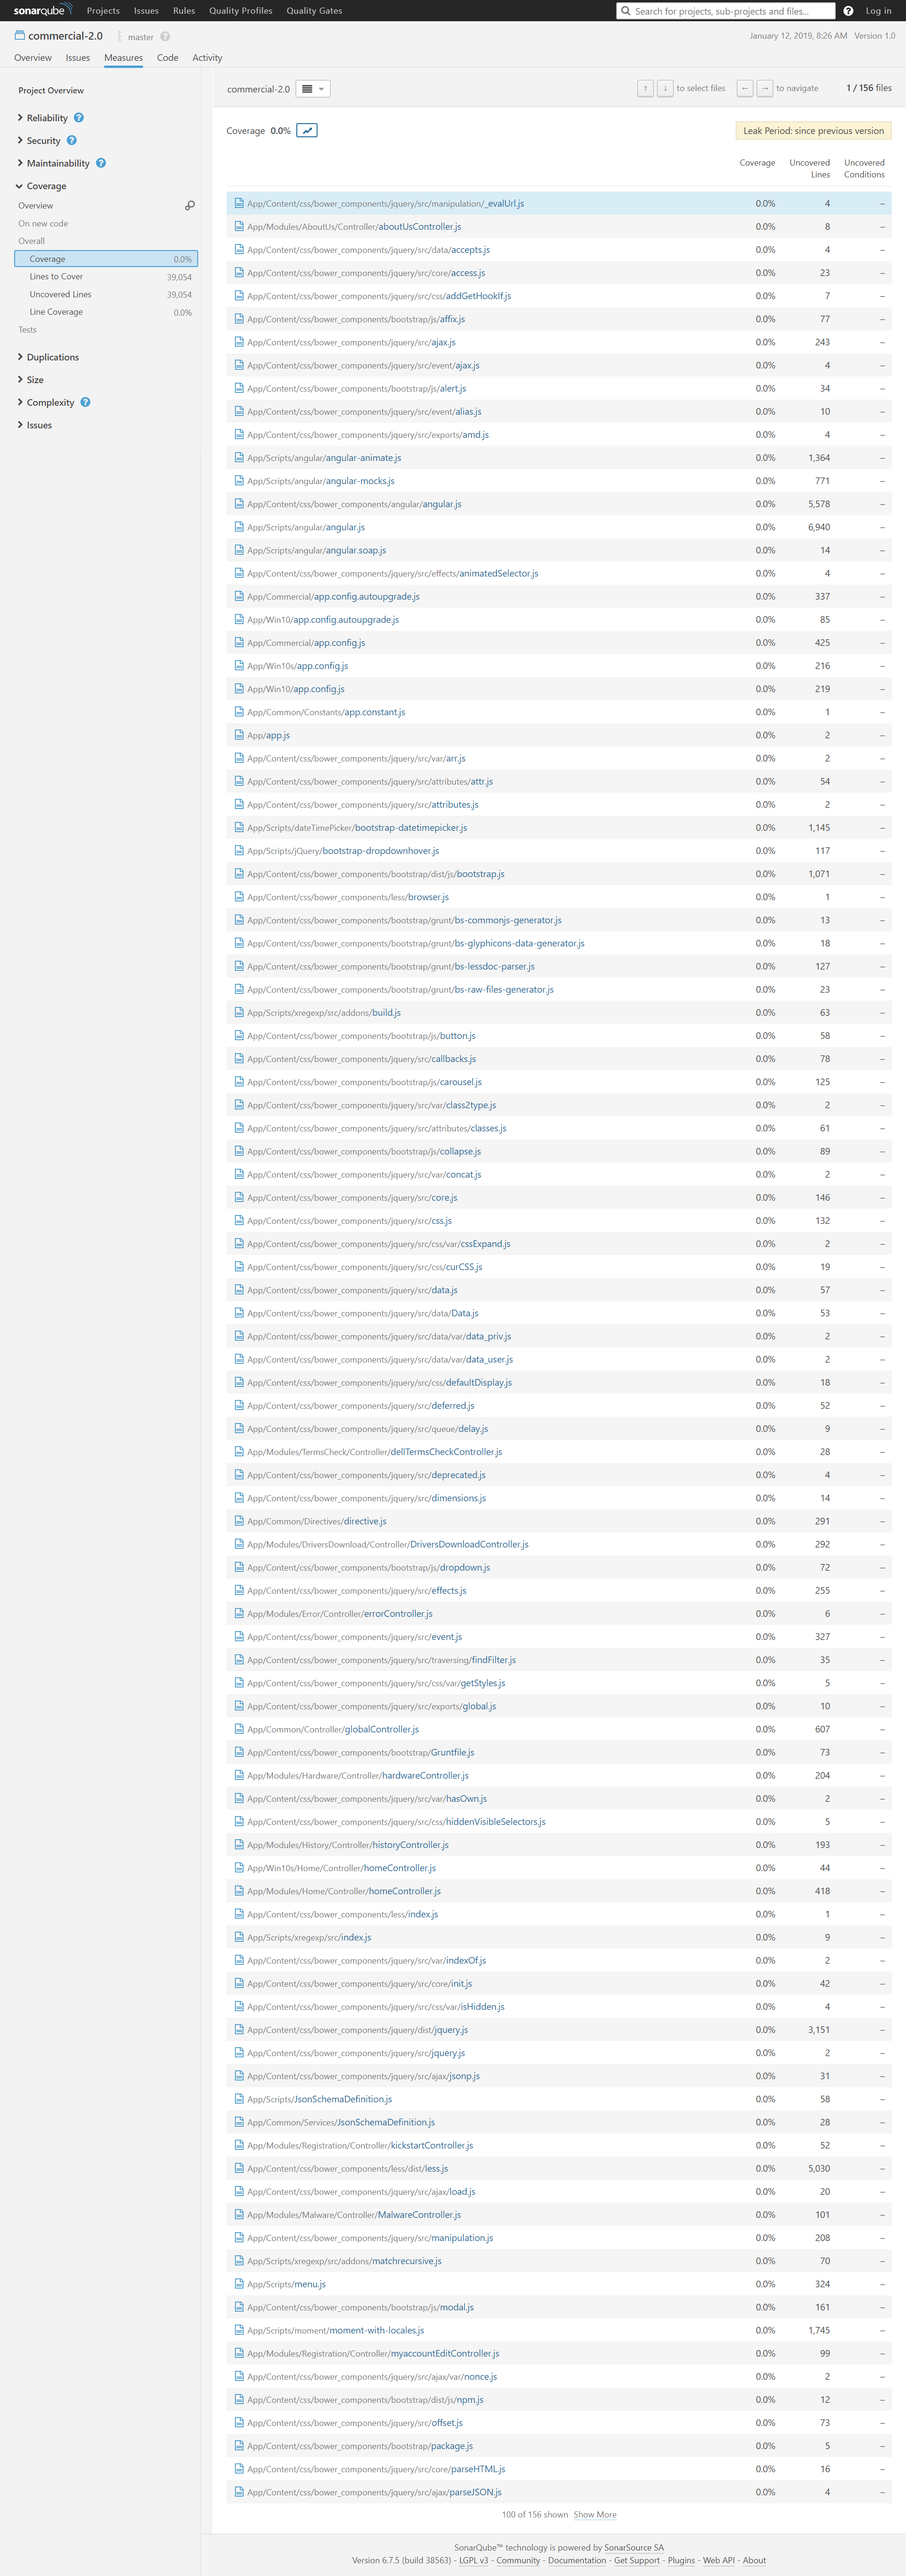
Very rarely i could see, sonarqube compiles and gives results, but if i check on the coverage it says 0.0%
FYI, i am using the following tools
-
dotcover Version: 2018.3.1
-
sonarqube - LTS - 6.7.x
-
MSBuild version (as in the output - 4.4.2)
P.S the problem is, the dotcover , after the analysis, able to generate the .html file, and i can see the results in it, but i am not able to see that in sonarqube. either it throws the above erros or it shoes 0.0% have given the additional arguments also :
(/d:sonar.cs.dotcover.reportsPaths="C:\Client\DEV\DEV_3.3.0\TEST\CoverageReport.html)
I have another question, as you can see in the above printed logs, sonarqube creates a separate coverage report and adds all the code in html format and tries to compress them.
Not sure what is this operation.
Pleae help, as i am stuck in this for a week. its very important.
 these html files , as you know , are the csharp files of our project. there were around 400-500 files generated, i just shared a snapshot of it.