Hello, We are using Sonarqube developer edition 9.7.1. Recently 2 of our pull requests even after getting successfully built on Jenkins and sonarqube report stage going fine, there is no data on those pull requests on sonarqube. I checked the background tasks page and there is no task for those pull requests. When I click on the links in the build log those give following error.
I have attached the build log file as well as system info file.
PS: Please note all of these exist behind our firewall so they will not be accessible from outside. If you need any other info please feel free to ask.
An update to this issue. One of the PR’s started working fine after we closed it and reopened same files in a totally new PR. Even though it’s working fine, I would like to know what caused this to happen and even after repeat scans on same PR the analysis didnt happen at all till we closed the PR in question and opened a new one.
Not that I’m saying 35k+ lines of log isn’t enough, but I think your log file cuts off before the end.
That said, the error screenshot in your latest post looks very relevant. I suspect the upload of the analysis report was interrupted. Typically this happens when a proxy “helpfully” decides the file is too big. And clearly this is a very large project.
The analysis log shows that the analysis report upload succeeded:
[2022-11-15T16:25:31.482Z] INFO: Analysis report generated in 3533ms, dir size=10.4 MB
[2022-11-15T16:25:41.456Z] INFO: Analysis report compressed in 9696ms, zip size=6.1 MB
[2022-11-15T16:25:41.713Z] INFO: Analysis report uploaded in 883ms
Backing up, I see that the analysis is configured to be of a PR:
[2022-11-15T16:19:40.865Z] INFO: Auto-configuring pull request '1156'
...
[2022-11-15T16:19:48.202Z] INFO: Pull request 1156 for merge into main from Feature/USB-Ecosystem/USB4v2_updateDiagramsDynamic
So when you check the branch/PR dropdown, you don’t see #1156 in the list?
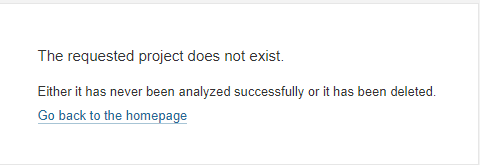
Hello, There are no errors in background task. Even in the ce logs the PR doesnt get detected. Also as you said the PR doesnt show up on the list when i click on the dropdown.
Can you check your server logs for the date & approximate time of the processing of the analysis report? It’s odd that there’s apparently no trace of the PRs.
Hi, Do you mean logs on the jenkins build server? Regarding the date and time, that is present in the build log when the PR analysis was done on Jenkins.
Hi, It was done yesterday evening so I don’t think that is the case. Can there be some issue from Jenkins side some kind of call failing to reach sonarqube. If there is some way to verify that, would be great.
And that makes me think of another thing to check on the SonarQube side: look at the access log for the submission of the analysis report. Make sure it got through.
So starting from the timestamp in the analysis log of analysis report submission
check the access log for that time to see that the analysis report arrived
from there you should be able to check the ce.log to see traces of the analysis report being first stored, then retrieved and processed
If you can trace all that through, then I’ll have to assume the PR got “misfiled” somehow… Looking back at the analysis log, I see a project key of BitifEye_ValiFrame_AYJn6DSFD-p1i8Lrcyyi. Is that what you expect it to be? I ask because of that random-looking part at the end…