I’m unable to get any code-coverage to show up in any of my scans. I’ve tried so many different things I don’t remember them all.
#Start with sonar begin as shown, this is from my Dockerfile

RUN dotnet build "<projectName>.csproj" -c Release -o /app/build

RUN dotnet test /Test<projectName>/Test.<projectName>.csproj --collect:"XPlat Code
Coverage"

FROM build AS publish
RUN dotnet publish "<projectName>.csproj" -c Release -o /app/publish

RUN dotnet sonarscanner end /d:sonar.token="${DOCKER_SONAR_TOKEN}"
This is running on a branch where there is no new code, I just want to get the test-coverage working before merging into main.
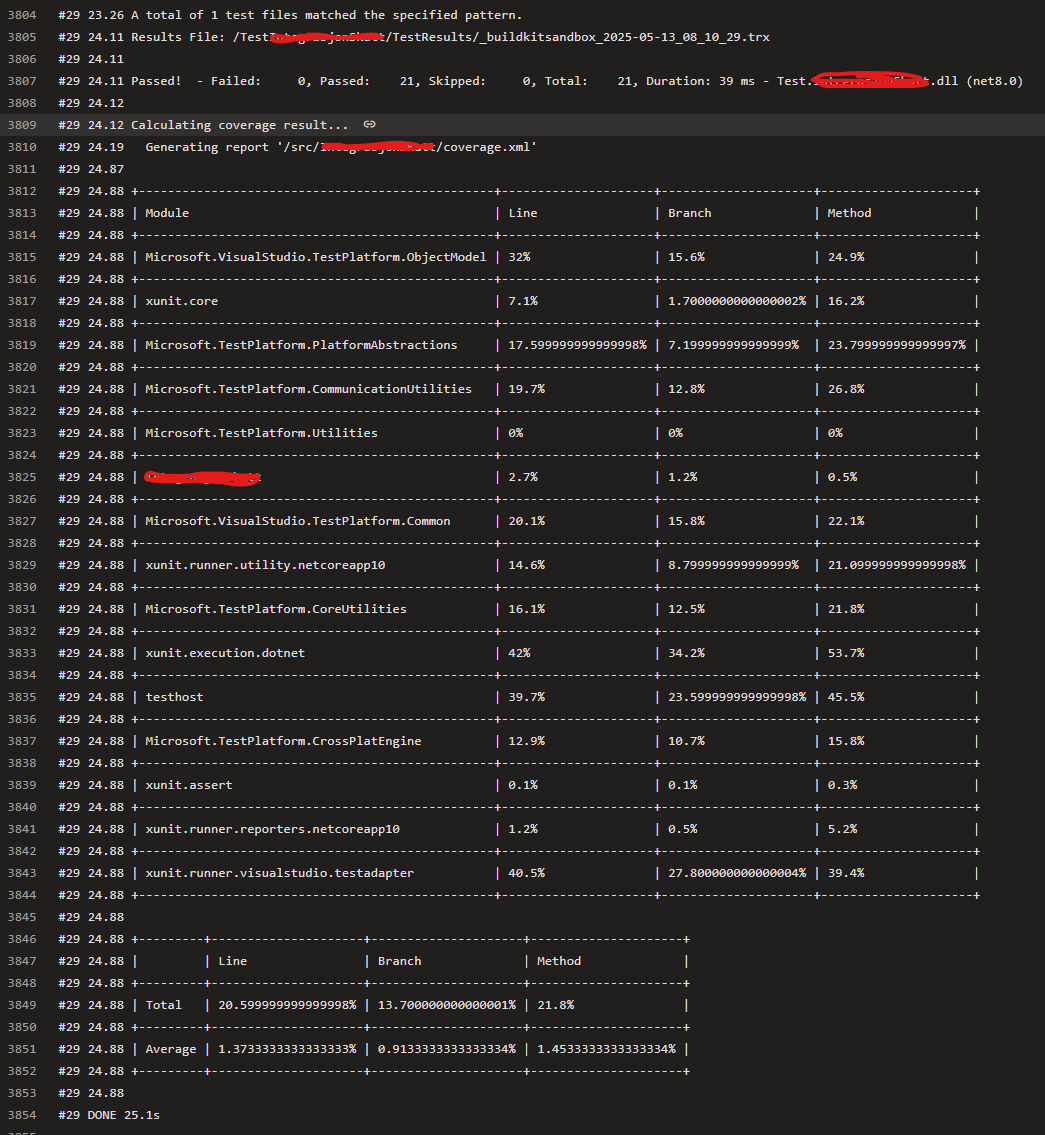
When looking at the step where the tests are run, I see that the tests get executed, and a report is generated, however this is not reflected in SonarCloud
I’ve come one step further, but I need some help figuring out what to do next.
#30 21.90 10:32:40.487 INFO: Sensor C# File Caching Sensor [csharpenterprise] (done) | time=25ms
#30 21.90 10:32:40.488 INFO: Sensor C# Tests Coverage Report Import [csharpenterprise]
#30 21.90 10:32:40.488 DEBUG: Analyzing coverage with wildcardPatternFileProvider with base dir '/src/XXX/.' and file separator '/'.
#30 21.90 10:32:40.489 DEBUG: Pattern matcher extracted prefix/absolute path '/src/XXX/./coverage.xml' from the given pattern 'coverage.xml'.
#30 21.91 10:32:40.490 DEBUG: Pattern matcher returns a single file: '/src/XXX/./coverage.xml'.
#30 21.91 10:32:40.491 DEBUG: The current user dir is '/src/XXX'.
#30 21.91 10:32:40.491 INFO: Parsing the OpenCover report /src/XXX/./coverage.xml
#30 21.91 10:32:40.496 DEBUG: The file '/_/src/Microsoft.TestPlatform.ObjectModel/Nuget.Frameworks/NoAllocEnumerateExtensions.cs' is not indexed or does not have the supported language. Will skip this coverage entry. Verify sonar.sources in .sonarqube\out\sonar-project.properties.
#30 21.91 10:32:40.497 DEBUG: CoveredFile created: (ID '1', path '/_/src/Microsoft.TestPlatform.ObjectModel/Nuget.Frameworks/NoAllocEnumerateExtensions.cs', NO INDEXED PATH).
#30 21.91 10:32:40.498 DEBUG: The file '/_/src/Microsoft.TestPlatform.ObjectModel/Nuget.Frameworks/SimplePool.cs' is not indexed or does not have the supported language. Will skip this coverage entry. Verify sonar.sources in .sonarqube\out\sonar-project.properties.
#30 21.91 10:32:40.498 DEBUG: CoveredFile created: (ID '2', path '/_/src/Microsoft.TestPlatform.ObjectModel/Nuget.Frameworks/SimplePool.cs', NO INDEXED PATH).
#30 21.91 10:32:40.499 DEBUG: The file '/_/src/Microsoft.TestPlatform.ObjectModel/Nuget.Frameworks/StringBuilderPool.cs' is not indexed or does not have the supported language. Will skip this coverage entry. Verify sonar.sources in .sonarqube\out\sonar-project.properties.
#30 21.92 10:32:40.500 DEBUG: CoveredFile created: (ID '3', path '/_/src/Microsoft.TestPlatform.ObjectModel/Nuget.Frameworks/StringBuilderPool.cs', NO INDEXED PATH).
#30 21.92 10:32:40.501 DEBUG: The file '/_/src/Microsoft.TestPlatform.ObjectModel/Nuget.Frameworks/HashCodeCombiner.cs' is not indexed or does not have the supported language. Will skip this coverage entry. Verify sonar.sources in .sonarqube\out\sonar-project.properties.
#30 21.92 10:32:40.501 DEBUG: CoveredFile created: (ID '4', path '/_/src/Microsoft.TestPlatform.ObjectModel/Nuget.Frameworks/HashCodeCombiner.cs', NO INDEXED PATH).
#30 21.92 10:32:40.501 DEBUG: The file '/_/src/Microsoft.TestPlatform.ObjectModel/Nuget.Frameworks/CompatibilityCacheKey.cs' is not indexed or does not have the supported language. Will skip this coverage entry. Verify sonar.sources in .sonarqube\out\sonar-project.properties.
#30 21.92 10:32:40.501 DEBUG: CoveredFile created: (ID '5', path '/_/src/Microsoft.TestPlatform.ObjectModel/Nuget.Frameworks/CompatibilityCacheKey.cs', NO INDEXED PATH).
And hundreds more of these entries.
I saw some other thread of there being an issue of code coverage not showing when there were 0 lines of code in a PR, but this isn’t a PR scan. It does however not have any code changes in it. Any help would be greatly apprecciated!
You are right, how can this be?? When running the tests in the dockerfile it lists successful tests from our unit test project. I can’t figure out how to troubleshoot this further
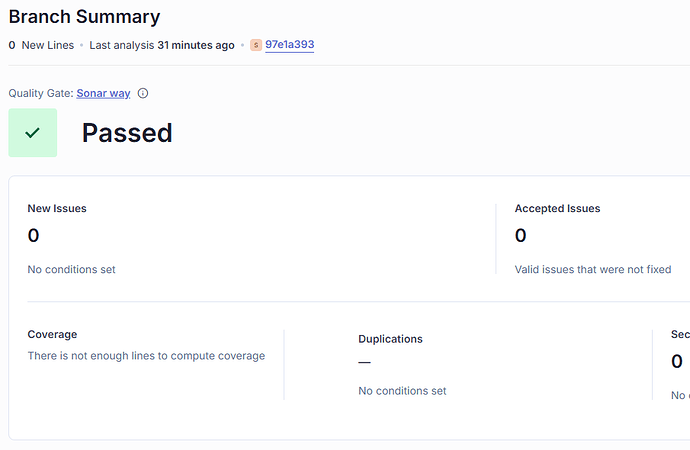
@Colin Is there a way to run a sonar scan on a short lived branch but still get a FULL scan of the entire repo? I’m finding it hard to actually see any change from run to run, and with the “There is not enough lines to compute coverage” I cannot really test if my setup is correct without merging to main, which I want to avoid if possible.
So after making our branch a long-lived branch we were able to get the code-coverage percentage to actually change.. So that’s great.
It seemed that the test-libraries included in our scan was from packages that we use, so those are fine to cover as well.
I think a lot of my problems were about not being able to see that percentage change, thinking that something was wrong. Had I merged to main and ran a full branch scan, I would have gottem my result almost right away. It would be nice knowing a bit more/having better documentation on the things I’ve learned here about how the different types of scans work. (PR scan, vs long-living-branch scan, vs short lived branch scan)
@Stine if I distill one additional takeaway here, I think it would be best if we showed the estimated coverage here even when there are no new lines to compute coverage on