[NEW RELEASE] Launching the OverOps plugin for SonarQube

Hi SonarQube, we’re excited to launch our new plugin for SonarQube!

Since this is the first release of this plugin, please also add it to the Plugin Library page. Attached is the required information for joining the marketplace.

Description

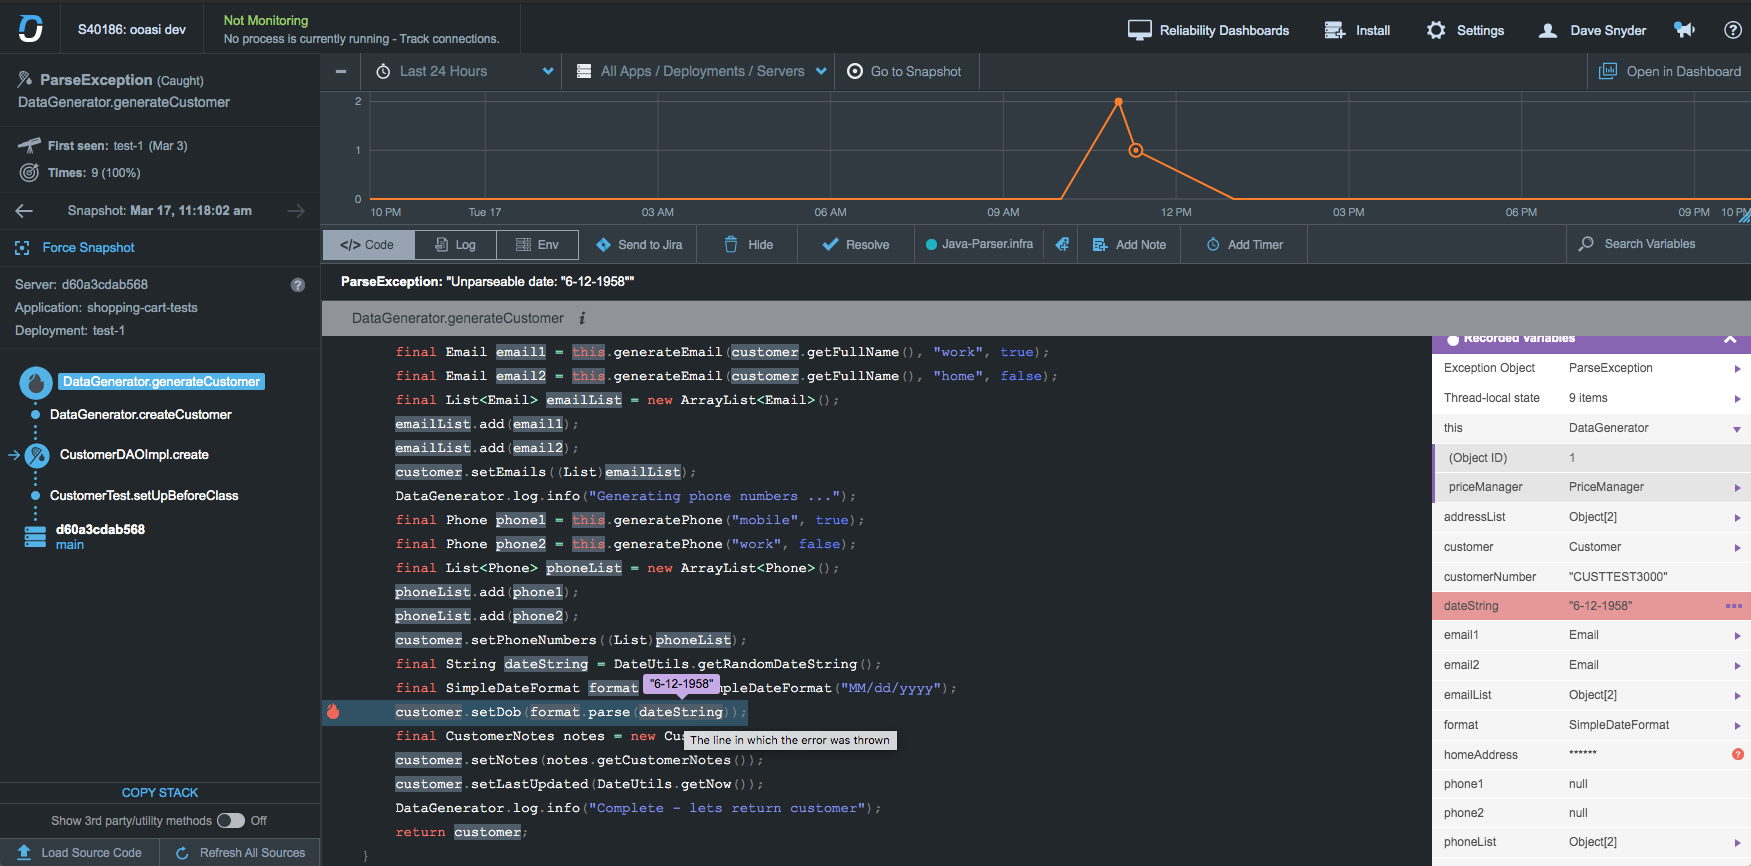
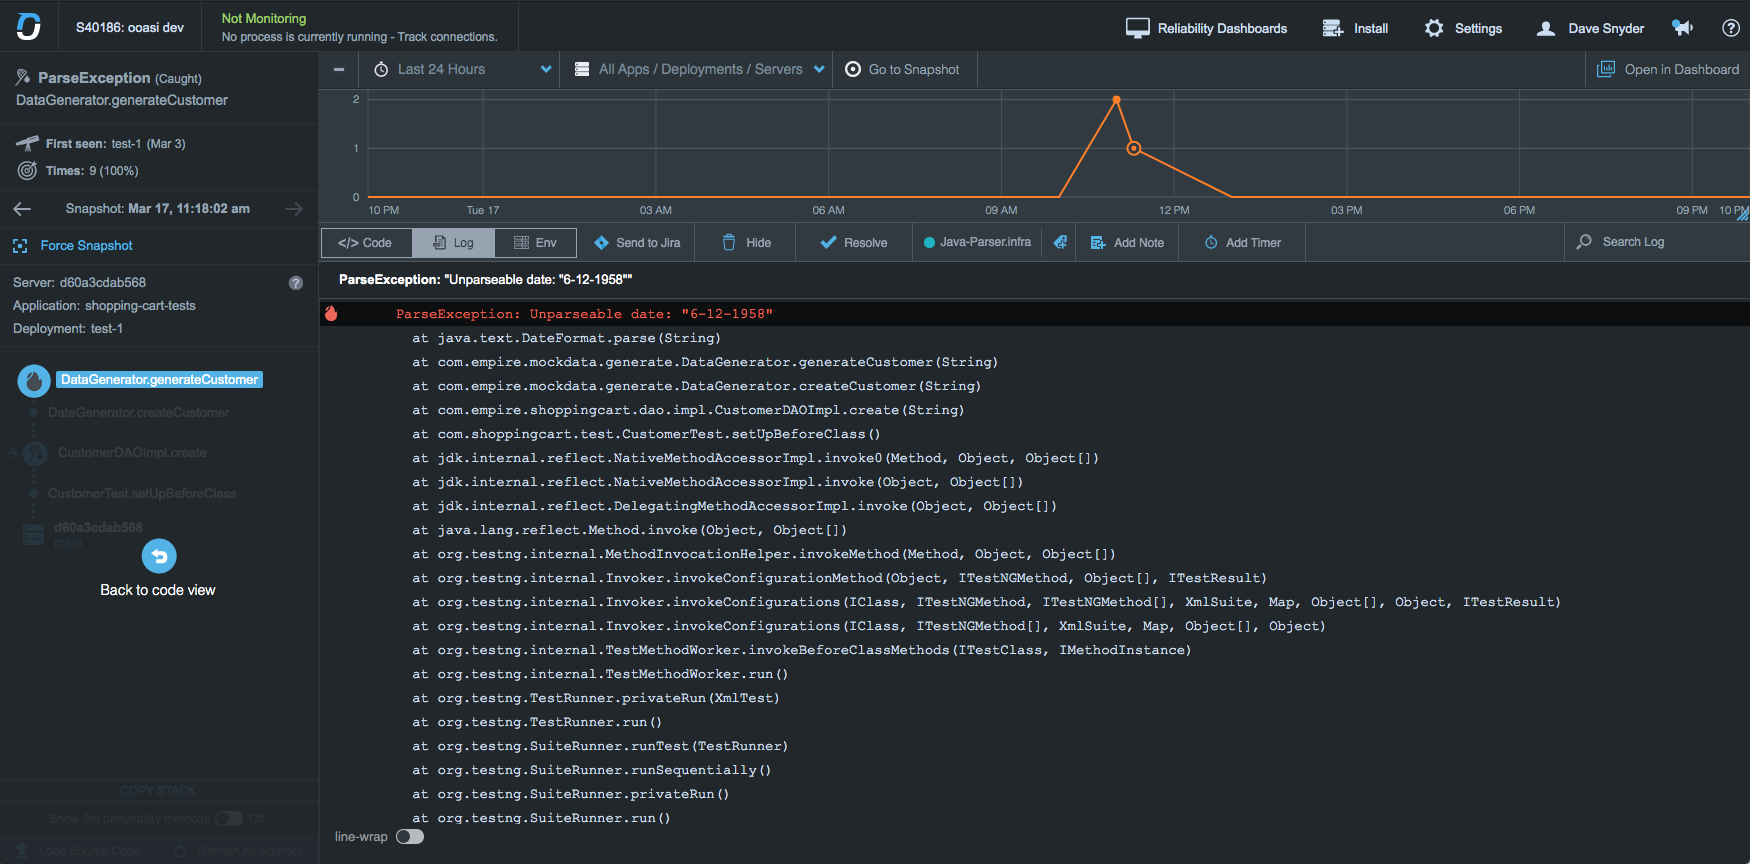
The plugin adds OverOps event data as Issues and Metrics in Sonar.

As a prerequisite, OverOps has to be attached to a JVM based application during the test phase in a CI pipeline to identify runtime errors resulting from poor code quality, including uncaught and swallowed exceptions.

The OverOps plugin for SonarQube adds new Measures for Critical Errors, New Errors, Resurfaced Errors, and Unique Errors. These Measures can be used to create Quality Gates to prevent the promotion of low quality code. In addition, Issues are created for each event detected by OverOps, allowing the user to quickly identify the offending line. Comments are added after the SonarScanner has completed its analysis which link to the OverOps error analysis screen for further context including complete variable state for each event detected.

While our plugin is free and open source, our product offers a trial that leads up to a commercial license. We’re happy to provide credentials for a test environment directly to anyone who would like them, however we cannot post credentials in a public forum. Please email me directly to request access: dave.snyder@overops.com

Plugin homepage and documentation: https://github.com/takipi-field/sonar-plugin-overops

SonarCloud Dashboard: https://sonarcloud.io/dashboard?id=takipi-field_sonar-plugin-overops

SonarQube Compatibility: 7.9, latest

PR for sonar-update-center-properties: https://github.com/SonarSource/sonar-update-center-properties/pull/101

Please let us know if you have any questions!

Hi,

I’m not ignoring this. I’ll get to it soon*

 
Ann

* For some definition of “soon”. :grin:

ok, thanks :slight_smile:

Hi,

I’ve done the bureaucratic review & aside from a minor issue on your PR, that all looks good. Now it’s on to the testing.

My understanding of the way this works is that the user essentially imports a test report during analysis…? If so, can you provide a test project complete with report to import?

I read (okay, skimmed) the docs and I’m not understanding why Anonymous jobs aren’t supported and how my SonarQube credentials would interact with the ARC screen.

Also, you mentioned not being able to freely provide credentials. Does that change if you’re publishing a dummy project for testing? Maybe you could publish creds that only have access to the dummy project?

 
Ann

Hi Ann, thanks for taking a look.

Let me try to clarify the workflow. When the user runs unit and integration tests, they attach the OverOps agent to the JVM running those tests. Our agent captures runtime errors and reports them to our backend. Then, when the Sonar Scanner is run our plugin queries our API for any events it may have for that run. There’s no test report generated, it’s all just API calls.

I can stand up a public instance of SonarQube with a project and results already in it if that would work for you.

We don’t support anonymous jobs because we use the login credentials to add a comment in the post build step to any issues we found. Without those credentials, we can’t add comments. The comment is simply a link to our Automated Root Cause screen, which contains detailed information about the runtime exception we found.

I can’t provide credentials on a public forum. We do have a free trial, so if folks are willing to sign up, they’ll be able to get their own credentials. I’m also happy to provide credentials directly to anyone who asks for them through private channels so that they don’t have to fill out the trial sign up form.

Hope that makes sense :slight_smile:

Thanks,
dave

Hi Dave,

I’ve started up my test instance with your plugin. I see you add one “OverOps Event” rule with a minimal - at best - description. Right at the moment, I’m skeptical, but yes please. Do spin up a demo SonarQube instance.

 
Ann

Hi Ann,

I stood up a demo instance and populated it with some sample data: https://sonar.overops-samples.com/dashboard?id=com.shoppingcart%3Ashopping-cart-demo

I understand your skepticism regarding our minimal “OverOps Event” rule. Since we’re a dynamic code quality tool, we can’t create predefined static rules for every possible exception or event we find. Instead, this rule is used as a catch all, enabling us to add issues for any event we find. Each issue describes why it was flagged and the link in the comments provides further context.

As an example, here we identify a swallowed exception, or an exception that wasn’t properly handled: https://sonar.overops-samples.com/project/issues?id=com.shoppingcart%3Ashopping-cart-demo&open=AXDpTsxcS9fteZwWKW7A&resolved=false&tags=overops

Thanks,
dave

Hi dave,

Even for this dummy project in a demo SQ instance you can’t provide credentials? If not, then I’ll need your email address. :smiley:

 
Ann

Please send me an email - dave.snyder@overops.com

Hi dave,

Thanks for the credentials.

Now that I’m looking at this… I’m not sure what I’m looking at. :smile:

It seems that you’re using an issue comment to link into another interface that presents… multiple issue locations across files. Which is natively supported in SonarQube and should have just been part of the initial issue. What should I be noticing here that can’t be conveyed in SonarQube?

Regarding the generic rule, I understand that you can’t have a rule for every possible exception. I do think you could easily have rules for categories. For instance, in the demo app you’ve provided I’m seeing two categories among the three issues:

  • New, Caught Exception
  • New, Critical, Swallowed Exception

Even if you end with a catchall, “other” category it would still be better than one rule. If you stick with one rule (:slightly_frowning_face:) I think you could do better on the description, with a discussion of why I care about these exceptions that were caught by test cases (meaning they were expected and perhaps even what was being tested…?). Because right now this is what I see:

Changing topic, you might want to take a look at how your metrics are listed at the file level:


Not sure what this first one means, and it looks like localization is missing for the 2nd one:

The points about the display of metrics and the number of rules are secondary. For me the primary issue here is how bare the issue presentation is in SonarQube and how quickly the user is linked away to another interface for information that should have been available in the initial, SQ presentation.

 
Ann

Hi Ann,

No worries, let me try to answer all of your questions.

We’re showing the variable state, JVM state, logs, the number of times the issue occured, the entry point and stack trace, and more. It’s not that the issue spans multiple lines of code, we just show you the state of everything that led to the issue - almost like a using a debugger.

For users who use us during their integration test phase, we’ll capture the all relevant code, not just the code from the individual project that was scanned with Sonar.

True, but this quickly becomes intractable. We have new, critical, unique, resurfaced, logged error, logged warning, swallowed exception, caught exception, uncaught exception, timer events, and more. All of these can be used in any combination. We also allow the user to define their own critical exceptions, the list of which is limitless.

To be blunt, the user should care because we found it, after all that’s why they’re using the plugin. I understand this is different from the traditional use of SonarQube, where each issue has a well defined set of criteria and a clear solution. The fix depends on what each individual issue is and since these are runtime issues, for most issues we can’t suggest what that fix would be and we certainly can’t do it in a static description. For example, if it’s a new error, how do I fix it? Is there a different fix for a new, critical error? Are all new errors or critical errors fixed the same way? The answer depends on what the underlying event to be fixed was, which requires a human to look at the code and variable state and determine what the solution should be. If what we found is not actually an issue, it can be marked resolved or hidden in the OverOps UI and it won’t be flagged again.

I’m not following your feedback on metrics. If we find an event, we’ll add it to the metrics for that file and roll it up through the folders to allow users to drill in and find the event. This allows for quality gates to be configured, so users can fail their builds if we detect too many events.

I guess I’m not sure what to do about this or what you’re looking for. We’ve leveraged everything we could on the SonarQube side. I’d love to add more dynamic rich data directly to SonarQube, but that doesn’t seem possible. If you have documentation or examples, please send them my way.

Our goal here is to fit into our users workflow and let them consume our data inside SonarQube. I’d say about 85% of the information they need is presented as an issue - the description of the problem and the line at which it occurred. If they need additional context, they can view that inside OverOps.

I’m happy to jump on Zoom to discuss your concerns, if you’d like.

Thanks,
dave

To address this specific example, the problem is not that an exception was thrown but that the exception was swallowed.

f8fa064644839fd858d0a4599bc06d4d170f9199_2_689x265

Quick update – We’ve officially launched the OverOps plugin for SonarQube :tada:

A public demo is live at https://demo.overops.com/sonarqube

We’ll be hosting a webinar on April 2, 2020: https://land.overops.com/static_vs_dynamic/

Additional resources: