SonarLint plugin version: SonarLint for Eclipse 10.11.0.82462
Programming language you’re coding in: Java
Is connected mode used:
Connected to SonarQube (and which version): Developer Edition v10.6 (92116)
Since we updated from 10.6.0.82217 to 10.10.0.82440 and later to 10.11.0.82462 many developers in our team reported errors due to SonarLint in Eclipse:
Hey @jmini, thanks for reaching out to us about this.
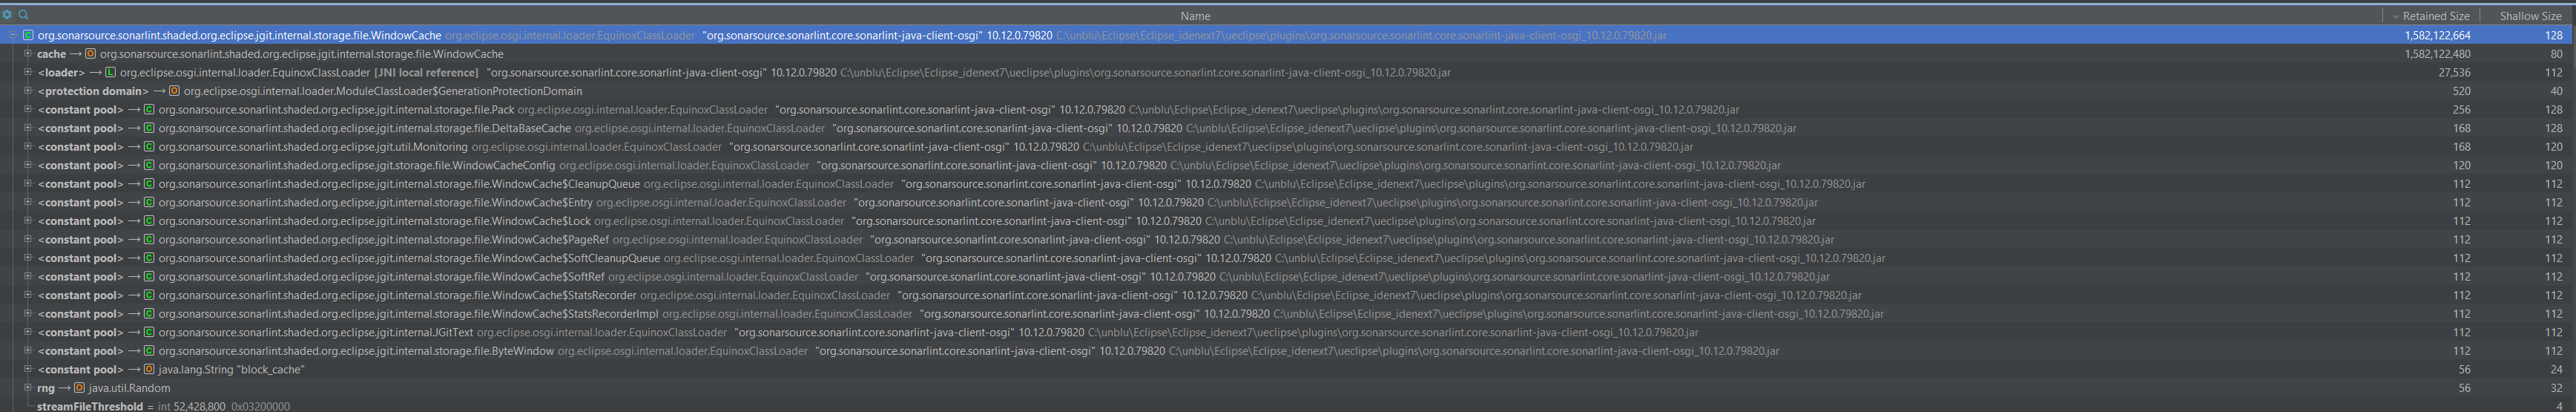
We are aware of this issue and are actively working on a solution. This is likely because we are blaming files from your project, and the blaming algorithm takes a lot of memory space to process all your git history. This is especially an issue for massive projects.
I can’t tell you when this will be fixed yet, but we are definitely making progress on this topic. We will keep you updated.
my colleague is currently on vacation, so I’ll be taking over. Before Christmas he was starting this investigation but did not conclude yet.
The next release for SonarQube for Eclipse 10.12 is planned for the end of the month but I cannot say for certain that this will be put into this version if this requires a lot of effort. But we will try of course
If you encounter this issue too often, then yes, please switch back to 10.6.0.82217.
We will keep you posted once everyone is back and we have results for you to work with
Do you have a public issue tracker where I can check when this issue is solved. I will not try to install 10.12 if this is not fixed, or if there is no option to turn off the “blame” feature.
Our project is 10+ years old. So yes the blaming operation takes its time in Eclipse IDE (I use it manually from time to time and it is acceptable for a single file, but computing it on every files locally seems an overkill).
OS : Windows 11
Eclipse version: 2024-12 (4.34.0)
Eclipse Build: Build id: 20241128-0757
Sonar plugin version : 10.12.0.82500
Connected mode : No. Not connected to SonarCube server or cloud.
When I right click on file and ask to Analyse, CPU usage increased for process SonarLintServerCli.
Nothing happens in eclipse, it is stuck at Sonarlint processing file…
On taking thread dump, “SonarLint Server RPC request executor” thread is taking CPU.
It is going in git blame or something. I am not looking for any of this stuff. Just want plain old file analysis. It is trying to use jgit do treewalk for files or something.
The SonarLint eclipse library calculates when each line in submitted file was changed. For this, it uses blame command and using jgit library. It runs endlessly for large project like mine. Don’t know why.
I commented the code which uses blame command. Then I built the sonarlint-core jar and copied new jar in eclipse plugin folder.
Now analysis result comes up very quickly. I am now using latest sonarlint plugin with patched sonarlint-core jar.
Request Sonarlint devs to please add an option in eclipse to bypass the blame.
Hey @RahulT, we appreciate your effort in investigating this issue. As mentioned in my previous message, this has already been identified on our side, and we are still actively working on this. Turning off the blaming would prevent us from computing the date the issue appeared in your project. We will soon develop optimizations that considerably reduce the time spent on this task. SonarQube for IDE is meant to run in near real-time, and I agree that in the current state, on a huge git project, this is not acceptable. Lastly, you can always downgrade to SonarQube for IDE 10.6.0.
We have not forgotten this issue at all; in fact, we’ve been focusing on it during the last few weeks. A fix should be expected in the next release. In any case, I will keep you updated here when it is released. Thanks for your patience.
A side question: is there an official way to downgrade to 10.6.0.82217?
I’ve found this link as a source of the old releases SonarSource Downloads-CDN but putting it as an Update site to Eclipse won’t work.
Downloading multiple files one-by-one from that link and installing locally is the only option, or am I missing something obvious?
Thanks for help.
NOTE: If I use https://eclipse-uc.sonarlint.org Update site in Eclipse it shows just 2 SonarLint versions available for download
the official way to downgrade is to uninstall the current version of SonarQube for Eclipse (or SonarLint). And afterwards install the specific version from the SonarSource Downloads CDN as you found.
But there is a twist with the URL you have: It is only the browsable one, meaning the one you can use to navigate in the browser.
The one for 10.6.0.82217 to be pasted into Eclipse is THIS. When comparing you will notice that it is missing the ?prefix=. I have honestly no idea why this is the case, it seems to be related where the SonarSource Downloads CDN is hosted. This is out of my reach tho.
I’ll ping our documentation team to update the info in the docs.
Hello! We have just released SonarQube for Eclipse version 11.2 that includes the improvements we mentioned earlier. Could you please update and see if you still notice any issue? Thanks!
Thanks for the instructions!
I’m still thinking if I need downgrading…
After installing 11.2.0 the memory issue has become less acute - my Eclipse crashed after 4 hours of intensive work and not immediately.
java.lang.OutOfMemoryError: Java heap space
	at java.base/java.util.Arrays.copyOfRange(Arrays.java:3822)
	at java.base/java.lang.StringLatin1.newString(StringLatin1.java:769)
	at java.base/java.lang.StringBuilder.toString(StringBuilder.java:453)
	at org.sonarsource.sonarlint.shaded.org.eclipse.jgit.internal.storage.file.RefDirectory.copy(RefDirectory.java:1070)
	at org.sonarsource.sonarlint.shaded.org.eclipse.jgit.internal.storage.file.RefDirectory.parsePackedRefs(RefDirectory.java:1050)
	at org.sonarsource.sonarlint.shaded.org.eclipse.jgit.internal.storage.file.RefDirectory.lambda$2(RefDirectory.java:994)
	at org.sonarsource.sonarlint.shaded.org.eclipse.jgit.internal.storage.file.RefDirectory$$Lambda$1725/0x00000236b4ebfbd8.apply(Unknown Source)
	at org.sonarsource.sonarlint.shaded.org.eclipse.jgit.util.FileUtils.readWithRetries(FileUtils.java:733)
	at org.sonarsource.sonarlint.shaded.org.eclipse.jgit.internal.storage.file.RefDirectory.readPackedRefs(RefDirectory.java:985)
	at org.sonarsource.sonarlint.shaded.org.eclipse.jgit.internal.storage.file.RefDirectory.refreshPackedRefs(RefDirectory.java:975)
	at org.sonarsource.sonarlint.shaded.org.eclipse.jgit.internal.storage.file.RefDirectory.getPackedRefs(RefDirectory.java:966)
	at org.sonarsource.sonarlint.shaded.org.eclipse.jgit.internal.storage.file.RefDirectory.exactRef(RefDirectory.java:325)
	at org.sonarsource.sonarlint.shaded.org.eclipse.jgit.lib.Repository.exactRef(Repository.java:1085)
	at org.sonarlint.eclipse.core.internal.vcs.JGitFacade.getHeadRef(JGitFacade.java:105)
	at org.sonarlint.eclipse.core.internal.vcs.JGitFacade.getCurrentCommitRef(JGitFacade.java:99)
	at org.sonarlint.eclipse.core.internal.vcs.VcsService$BranchChangeJob.lambda$0(VcsService.java:112)
	at org.sonarlint.eclipse.core.internal.vcs.VcsService$BranchChangeJob$$Lambda$1738/0x00000236b4bc2a58.accept(Unknown Source)
	at java.base/java.util.ArrayList.forEach(ArrayList.java:1511)
	at org.sonarlint.eclipse.core.internal.vcs.VcsService$BranchChangeJob.run(VcsService.java:111)
	at org.eclipse.core.internal.jobs.Worker.run(Worker.java:63)
After re-starting and deleting the folder <workspace>/.sonarlint/storage/736f6e61722e756e626c752e636f6d/plugins it seems to work again… Is it related?
But we are not sure if we should push 11.2.0.82640 to all our devs now.
I can confirm similar observations: today my Eclipse with SonarLint 11.2.0 started crashing OOM immediately after start with the message
!ENTRY org.eclipse.core.jobs 4 2 2025-03-06 14:58:40.920
!MESSAGE An internal error occurred during: "Synchronizing projects...".
!STACK 0
java.lang.OutOfMemoryError: Java heap space
	at java.base/java.util.stream.ReferencePipeline.filter(ReferencePipeline.java:166)
	at org.eclipse.ui.internal.progress.ProgressManager.rememberListenersForJob(ProgressManager.java:715)
	at org.eclipse.ui.internal.progress.ProgressManager.refreshJobInfo(ProgressManager.java:631)
	at org.eclipse.ui.internal.progress.ProgressManager$JobMonitor.internalWorked(ProgressManager.java:279)
	at org.eclipse.ui.internal.progress.ProgressManager$JobMonitor.worked(ProgressManager.java:326)
	at org.sonarlint.eclipse.ui.internal.job.BackendProgressJobScheduler$BackendProgressJob.run(BackendProgressJobScheduler.java:109)
	at org.eclipse.core.internal.jobs.Worker.run(Worker.java:63)
Deletion of the .sonarlint workspace subdirectory helped making Eclipse usable.
Probaby need going to downgrade SonarQube Lint…