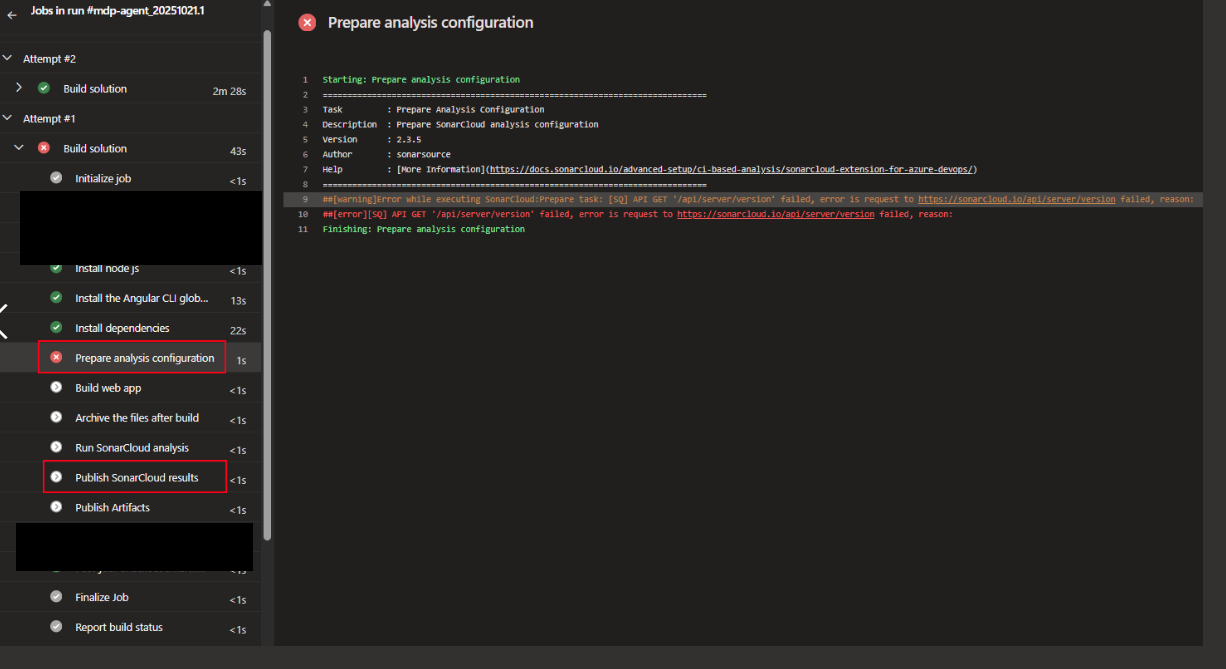
##[debug][DEBUG] SonarQube Cloud: API GET: '/api/server/version' with full URL "https://sonarcloud.io/api/server/version" and query "undefined"
##[debug][DEBUG] SonarQube Cloud: API GET '/api/server/version' failed. Error message: .
##[error][ERROR] SonarQube Cloud: Error while executing task Prepare: API GET '/api/server/version' failed. Error message: .
##[debug]Processed: ##vso[task.issue type=error;source=TaskInternal;][ERROR] SonarQube Cloud: Error while executing task Prepare: API GET '/api/server/version' failed. Error message: .
##[debug]task result: Failed
##[error]API GET '/api/server/version' failed. Error message: .
Publish SonarCloud results to azdo:
##[debug][DEBUG] SonarQube Cloud: API GET: '/api/metrics/search' with full URL "https://sonarcloud.io/api/metrics/search" and query "{"f":"name","ps":"500"}"
##[debug][DEBUG] SonarQube Cloud: API GET '/api/metrics/search' failed. Error message: .
##[error][ERROR] SonarQube Cloud: API GET '/api/metrics/search' failed. Error message: .
##[debug]Processed: ##vso[task.issue type=error;source=TaskInternal;][ERROR] SonarQube Cloud: API GET '/api/metrics/search' failed. Error message: .
##[error][ERROR] SonarQube Cloud: Error while executing task Publish: Could not fetch metrics
##[debug]Processed: ##vso[task.issue type=error;source=TaskInternal;][ERROR] SonarQube Cloud: Error while executing task Publish: Could not fetch metrics
##[debug]task result: Failed
##[error]Could not fetch metrics
##[debug]Processed: ##vso[task.issue type=error;source=TaskInternal;]Could not fetch metrics
##[debug]Processed: ##vso[task.complete result=Failed;]Could not fetch metrics
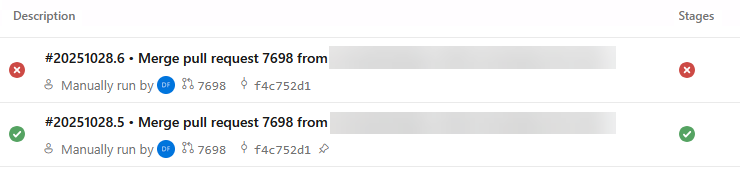
This does not happen every time the pipeline is run, as illustrated by the following two pipeline runs that occurred within minutes of each other:
We have the same issue with our Azure Devops pipeline, about 2/3 of runs are failing.
Most errors are happing in the prepare step:
##[error][ERROR] SonarQube Cloud: Error while executing task Prepare: API GET '/api/server/version' failed. Error message: read ECONNRESET.
##[error]API GET '/api/server/version' failed. Error message: read ECONNRESET.
Sometimes when the prepare succeeds, the publish result step fails:
##[error][ERROR] SonarQube Cloud: API GET '/api/metrics/search' failed. Error message: Client network socket disconnected before secure TLS connection was established.
##[error][ERROR] SonarQube Cloud: Error while executing task Publish: Could not fetch metrics
##[error]Could not fetch metrics
Hi ! today our pipelines started failing when running the sonar tasks. Especially started failing the preparation of sonar, with a GET request to the version failed. The logs of the task do not log any error response nor status code.
The logs below are run with the debug-mode enabled so that we have the maximum logs possible
we are still facing this issue across different Azure DevOps pipelines.
The issue appears when running SonarCloudPrepare@2 / SonarCloudPrepare@3 tasks, or SonarCloudPublish@2 / SonarCloudPublish@3 tasks.
It is intermittent, as in, does not show up on all pipeline runs (devs currently re-running pipelines until it works).
And we’ve ruled out network/FW as a source of the issue.
I expect that there is something strange going on with Node’s communication to SonarQube Cloud. NodeJS is used specifically in the Prepare (only when using the cli mode, rather than dotnet and Publish steps).
If you’re consistently encountering this issue, I’d like to determine whether it can be reproduced outside of the Azure DevOps tasks—for example, by performing a direct curl request from the agent.
You can try adding the following script to your Azure DevOps pipeline to check for transient connectivity issues. This will run the curl command multiple times, providing useful diagnostic output:
- script: |
    for i in {1..10}; do
      echo "=== Attempt $i ===";
      curl -v --max-time 10 https://sonarcloud.io/api/server/version;
      echo "Exit: $?";
      sleep 2;
    done
  displayName: 'Test SonarCloud connectivity (10x)'
  continueOnError: true
What to look for in the results:
If the request fails intermittently, even outside the Azure task, it suggests an external connectivity or network issue.
If curl always succeeds but the Azure DevOps task fails, the problem is likely within the task or its configuration.
Gathering this data will help further diagnose the issue.
Hi @Colin we we using SonarQube Cloud for few years, and recently we face the issue mentioned in the thread.
the issue is inconsistent and we need to re-run the pipeline twice/thrice manually and it is running fine. But this is happening frequently recently.
there are 2 issues:
##[error][ERROR] SonarQube Cloud: API GET ‘/api/metrics/search’ failed. Error message: .
##[error][ERROR] SonarQube Cloud: Error while executing task Publish: Could not fetch metrics
##[error]Could not fetch metrics
adding one more error we faced today:
##[error][SQ] Could not fetch metrics
##[error][SQ] API GET ‘/api/metrics/search’ failed, error was: {“code”:“ETIMEDOUT”}
##[error][SQ] API GET ‘/api/server/version’ failed, error was: {“code”:“ETIMEDOUT”}
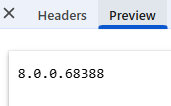
We’ve just released a new version of the extension with more logs and an upgraded version of the Axios library. Can you make sure you’re using v4.0.3 of the extension/task and see if you still get an error?
If so, please enable debug logging and give us the logs.