Getting 401 unauthorized in my Jenkins pipeline script, but when I access it manually I am able to click the report with out any issues

I am getting below error as 401 Unauthorized while access quality Gate

[Pipeline] waitForQualityGate **10:11:24** Checking status of SonarQube task 'Task ID' on server 'SonarQube' [Pipeline] } [Pipeline] // script [Pipeline] } [Pipeline] // stage [Pipeline] echo **10:11:25** Failed on sonarQube - Error 401 on http://IPAddress:9000/api/ce/task?id=Task ID :

I am using SonarQube Scanner2.11 Jenkins Plugin
Running Jenkins Version - Jenkins 2.240

Here is the pipeline snippet

stage(‘Scan’) {
withSonarQubeEnv(‘SonarQube’) {
sh ‘sbt scalastyleGenerateConfig’
sh ‘sbt scalastyle’
sh ‘sbt coverageReport’
//sh ‘cp ~/sonar-project.properties .’
sh ‘sbt sonar’
}
script {
sleep(20)
def qg = waitForQualityGate()
if (qg.status != ‘OK’) {
error “Pipeline aborted due to quality gate failure: ${qg.status}”
}
}
}

Screenshot of globally set Auth token.
image

Here is the screenshot for the results if I access manually.

Hi,

Welcome to the community!

What’s your version of SonarQube? And can you verify that you’ve actually set an analysis token in your global configuration?

 
Ann

Hello Ann,

Thanks for responding.

here are the details you looking for.
Community Edition
Version 7.9.3 (build 33349)

Please let me know if anything missing or needed, Thank you

Hi,

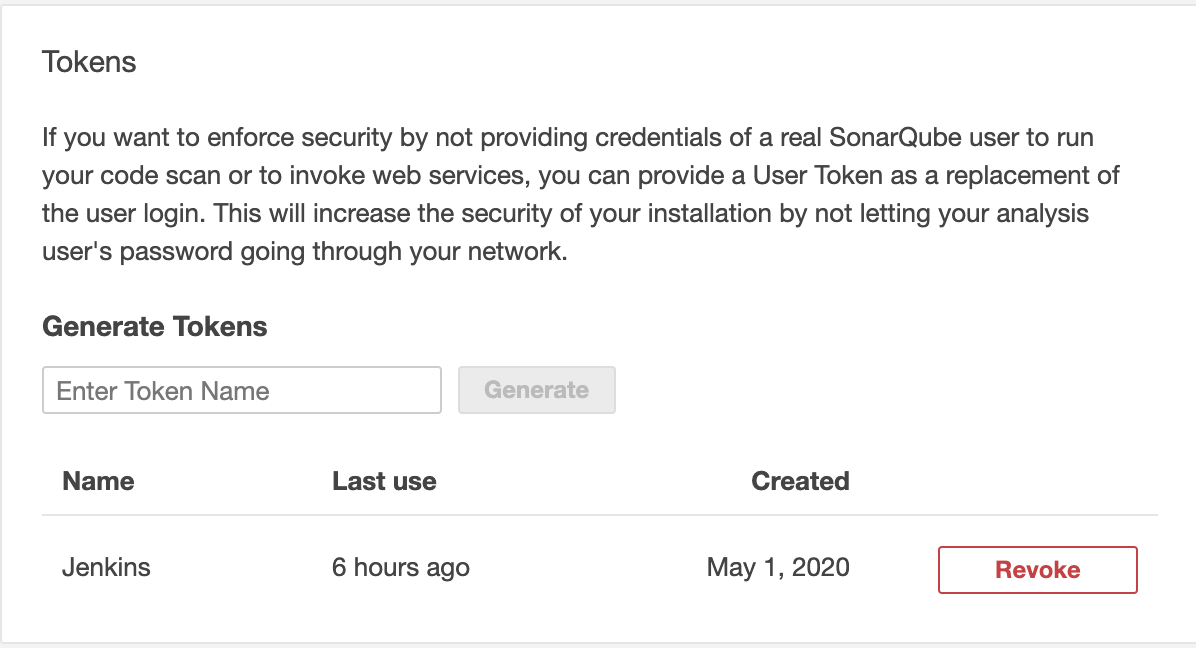
Your screenshots show that you have created a token. What I’m asking is whether you’ve configured (no, don’t show me! just look for yourself :smiley:) that token in the Jenkins global config.

From the screenshot in your OP, it looks like you might not have done that configuration, but I’m no longer familiar with the current Jenkins UI.

 
Ann

Yes we do have Token configured in Jenkins.
image

Hi @rmeka

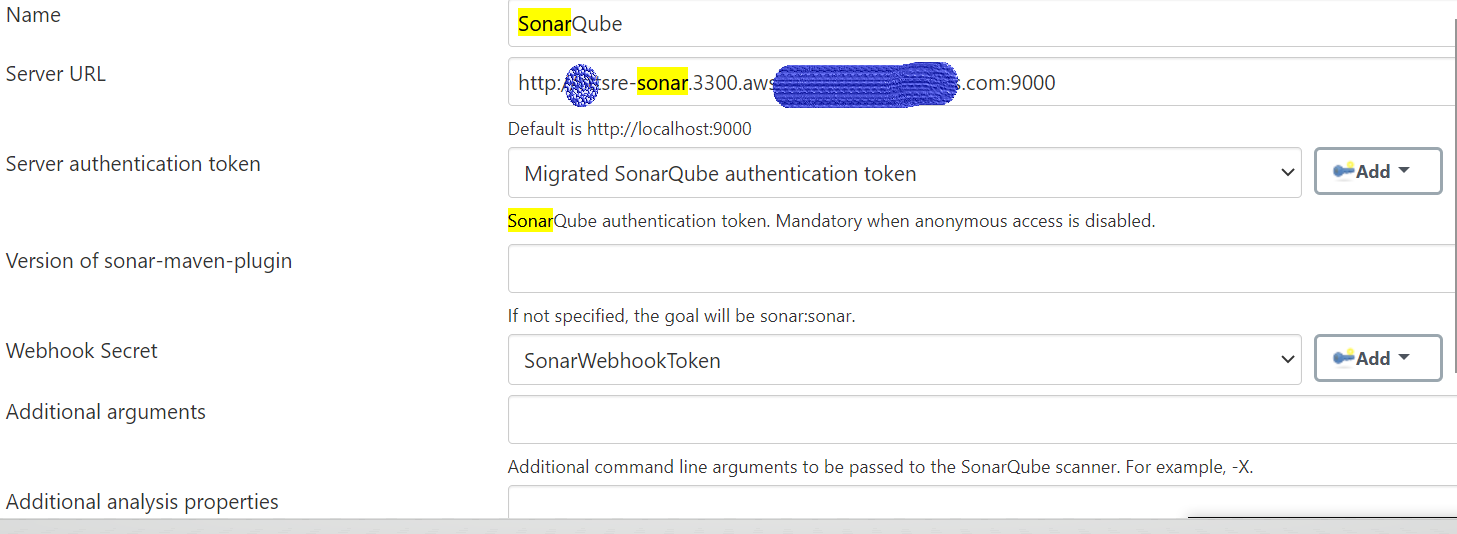
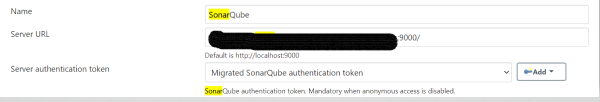
Looking at the latest screenshot it looks like you are using a migrated credential. This is done on a previous version of Jenkins where all credentials are migrated to the Jenkins credentials store.

Can you verify that the credentials in the secret Migrated SonarQuge authenticaton token is correct.

You may want to upgrade to Jenkins plugin 2.12. It contains improvements to the waitForQualityGate step.
And you may also want to try to wrap the waitForQualityGate() step in a new Jenkins stage as is done in the examples; https://docs.sonarqube.org/latest/analysis/scan/sonarscanner-for-jenkins/

Also, can you check the logs of Jenkins for any messages related to the waitForQualityGate and share those.

@Mark_Rekveld Thank you for checking,

Here are the changes I made now, I got a different error, it’s 404. Before the below changes, I don’t have any issues accessing the endpoint manually.

                    try {
                    stage('Scan') {
                        withSonarQubeEnv('SonarQube') {
                            sh 'sbt scalastyleGenerateConfig'
                            sh 'sbt scalastyle'
                            sh 'sbt coverageReport'
                            sh 'sbt sonar'
                        }
                        script {
                            sleep(20)
                            def qg = waitForQualityGate(webhookSecretId: 'xxxSREJenkins')
                            if (qg.status != 'OK') {
                                error "Pipeline aborted due to quality gate failure: ${qg.status}"
                            }
                        }
                    }
                } catch (e) {
                    echo "Failed on sonarQube - ${e.getMessage()}"
                }
                finally {
                    publishHTML([
                            ])
                }


Here is the Jenkins console output.

11:52:08 16:52:07.716 INFO - ANALYSIS SUCCESSFUL, you can browse http://10.x.x.x:9000/dashboard/index/compute-engine
11:52:08 16:52:07.721 INFO - Note that you will be able to access the updated dashboard once the server has processed the submitted analysis report
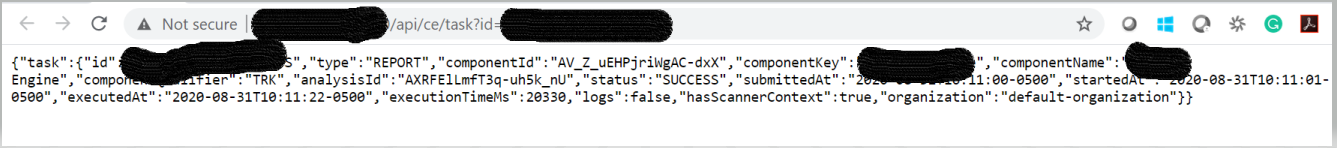
11:52:08 16:52:07.721 INFO - More about the report processing at http://10.x.x.x.:9000/api/ce/task?id=AXXXXXXXXXXXXX-2
11:52:08 16:52:07.903 INFO - Task total time: 22.671 s
11:52:08 INFO: ------------------------------------------------------------------------
11:52:08 INFO: EXECUTION SUCCESS
11:52:08 INFO: ------------------------------------------------------------------------
11:52:08 Total time: 41.095s
11:52:08 Final Memory: 31M/979M
11:52:08 INFO: ------------------------------------------------------------------------
[Pipeline] }
[Pipeline] // withSonarQubeEnv
[Pipeline] script
[Pipeline] {
[Pipeline] sleep
11:52:10 Sleeping for 20 sec
[Pipeline] waitForQualityGate
11:52:30 Checking status of SonarQube task ‘AXXXXXXXXXXXXX-2’ on server ‘SonarQube’
[Pipeline] }
[Pipeline] // script
[Pipeline] }
[Pipeline] // stage
[Pipeline] echo
11:52:30 Failed on sonarQube - Error 404 on http://sre-sonar.3300.aws-company.com:9000/api/ce/task?id=AXXXXXXXXXXXXX-2 : {“errors”:[{“msg”:“No activity found for task ‘AXXXXXXXXXXXXX-2’”}]}

In Sonar Qube Last delivery is Never

Please feel free to let me know if anything required from my end.

Thanks
-Raj

Here is the SonarQube Server