Template for a good new topic, formatted with Markdown:
- ALM used : Azure DevOps
- CI system used : Azure DevOps
- Languages of the repository : Nodejs, Reactjs
- Command used to trigger Test framework : npm test run
The team is using Mocha and Chai test framework. While the Developer is executing the tests from local laptop / desktop, this provides a different metric, while after Sonar Cloud analysis, the metric mentioned in the Sonar UI is different. Ex. as attached.
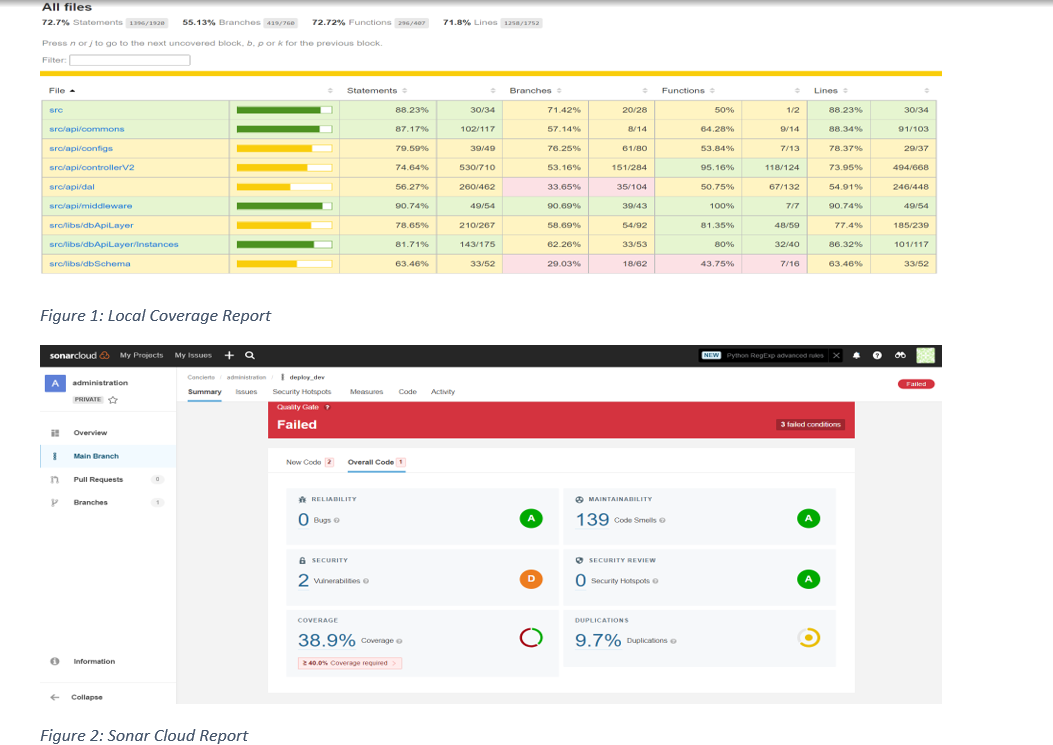
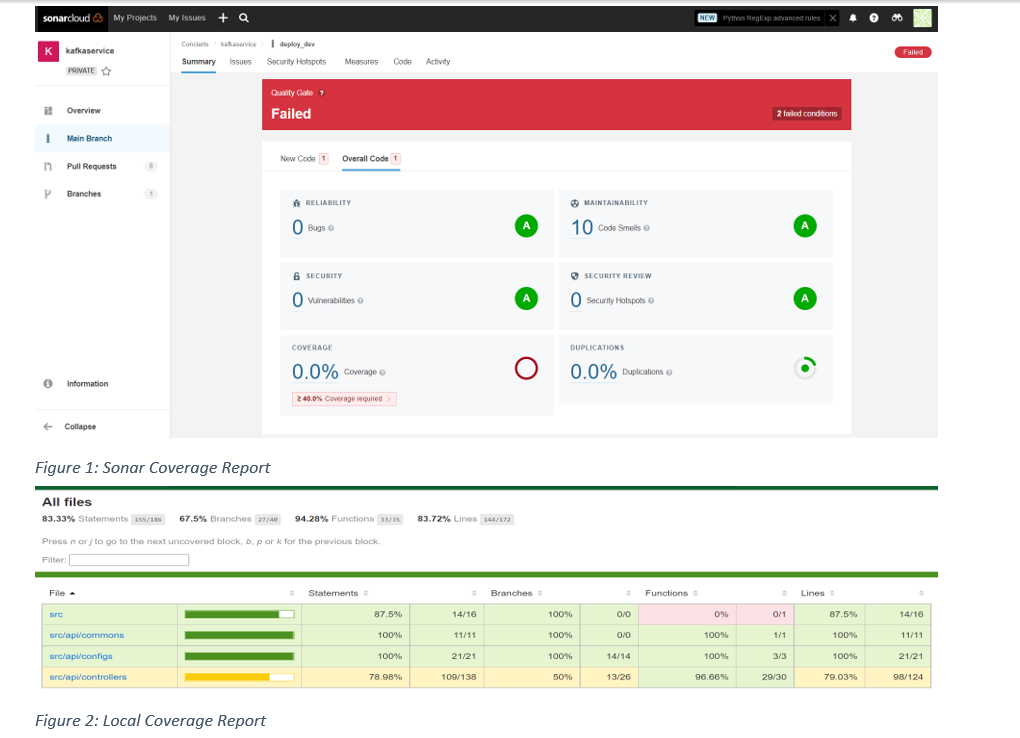
As shown in above attached reports, the metrics are not the same.
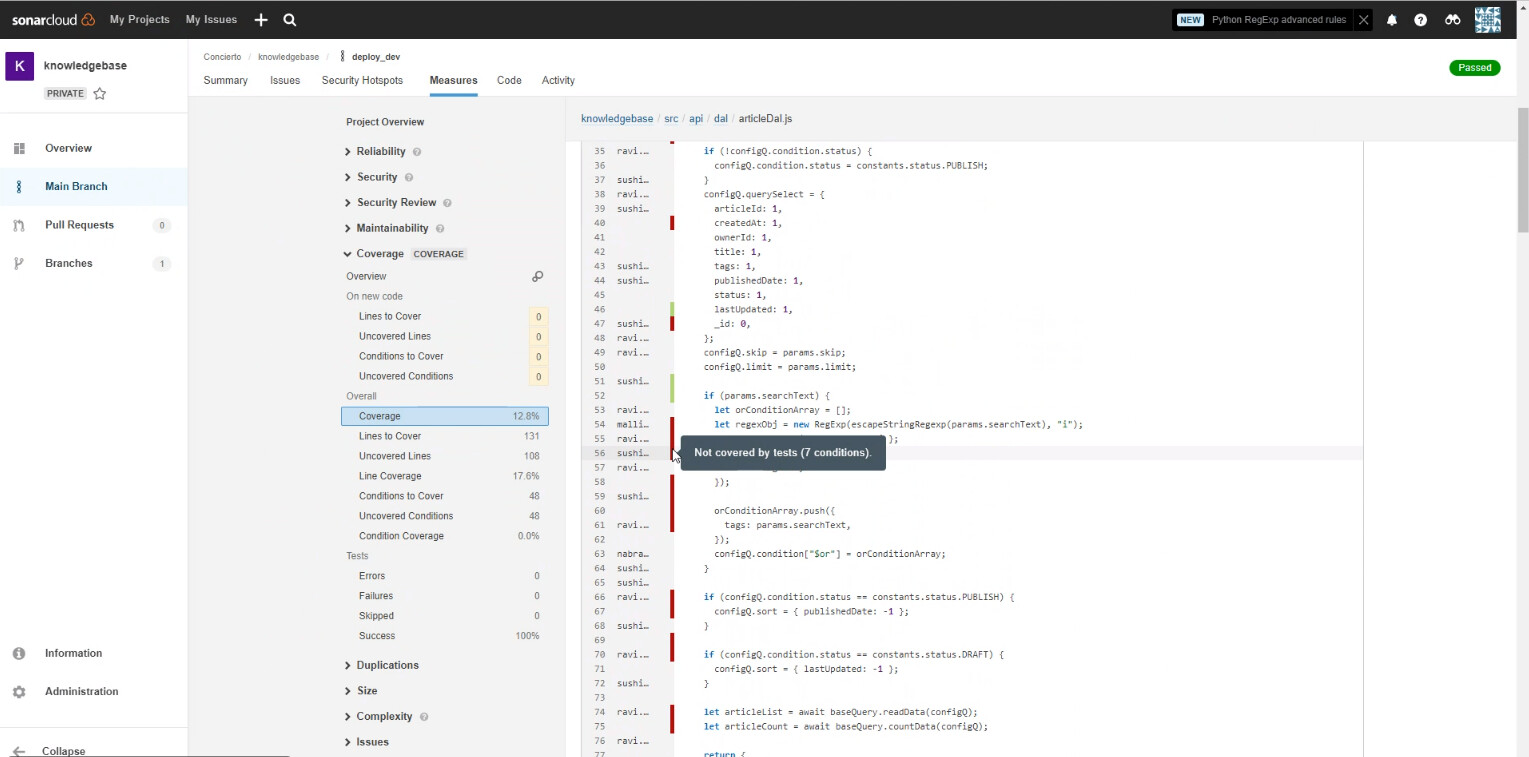
One more ask from our side is there are some lines mentioned in SonarCloud UI where it mentions some lines not covered by Tests, ex. a line that declares a variable. Not sure how to make the tests to get these lines covered as well.
Any help would be appreciated ! Kindly let know for more information.
Thanks,
PremKumar