INFO: 21:08:31.001678 Tarjan found 151826 components

INFO: 21:08:31.166449 Variable type analysis: done

INFO: Analyzing 30789 ucfgs to detect vulnerabilities.

INFO: Taint analysis starting. Entrypoints: 2708

INFO: Running symbolic analysis for 'JS'

##[error]Exception in thread "HttpClient-1-Worker-7"

##[error]java.lang.OutOfMemoryError: Java heap space

at java.base/java.util.concurrent.CompletableFuture.completeExceptionally(CompletableFuture.java:2087)

at java.net.http/jdk.internal.net.http.PlainHttpConnection$ConnectEvent.lambda$handle$1(PlainHttpConnection.java:137)

at java.net.http/jdk.internal.net.http.PlainHttpConnection$ConnectEvent$$Lambda$1310/0x0000000100bef040.run(Unknown Source)

at java.base/java.util.concurrent.ThreadPoolExecutor.runWorker(ThreadPoolExecutor.java:1128)

at java.base/java.util.concurrent.ThreadPoolExecutor$Worker.run(ThreadPoolExecutor.java:628)

at java.base/java.lang.Thread.run(Thread.java:829)

java.lang.OutOfMemoryError: Java heap space

at java.base/java.util.concurrent.CompletableFuture.completeExceptionally(CompletableFuture.java:2087)

at java.net.http/jdk.internal.net.http.PlainHttpConnection$ConnectEvent.lambda$handle$1(PlainHttpConnection.java:137)

at java.net.http/jdk.internal.net.http.PlainHttpConnection$ConnectEvent$$Lambda$1310/0x0000000100bef040.run(Unknown Source)

at java.base/java.util.concurrent.ThreadPoolExecutor.runWorker(ThreadPoolExecutor.java:1128)

at java.base/java.util.concurrent.ThreadPoolExecutor$Worker.run(ThreadPoolExecutor.java:628)

at java.base/java.lang.Thread.run(Thread.java:829)

##[error]ERROR: isAlive was interrupted

java.lang.InterruptedException: null

at java.base/java.util.concurrent.CompletableFuture.reportGet(CompletableFuture.java:385)

at java.base/java.util.concurrent.CompletableFuture.get(CompletableFuture.java:1999)

at java.net.http/jdk.internal.net.http.HttpClientImpl.send(HttpClientImpl.java:541)

at java.net.http/jdk.internal.net.http.HttpClientFacade.send(HttpClientFacade.java:119)

at org.sonar.plugins.javascript.eslint.EslintBridgeServerImpl.isAlive(EslintBridgeServerImpl.java:331)

at org.sonar.plugins.javascript.eslint.EslintBridgeServerImpl.heartbeat(EslintBridgeServerImpl.java:121)

at java.base/java.util.concurrent.Executors$RunnableAdapter.call(Executors.java:515)
The pipeline/Sonar Analysis stopped working as of 22nd November 2022, we haven’t made any changes to the configuration.
I’ve looked at similar topics and added the configuration for increasing memory but that did not help. Looking at the last successful run, there is enough spare memory, so not sure what’s going wrong.
1. INFO: Analysis total time: 12:34.332 s

INFO: ------------------------------------------------------------------------

INFO: EXECUTION SUCCESS

INFO: ------------------------------------------------------------------------

INFO: Total time: 12:45.166s

INFO: Final Memory: 1006M/1736M

INFO: ------------------------------------------------------------------------

Finishing: Run Code Analysis
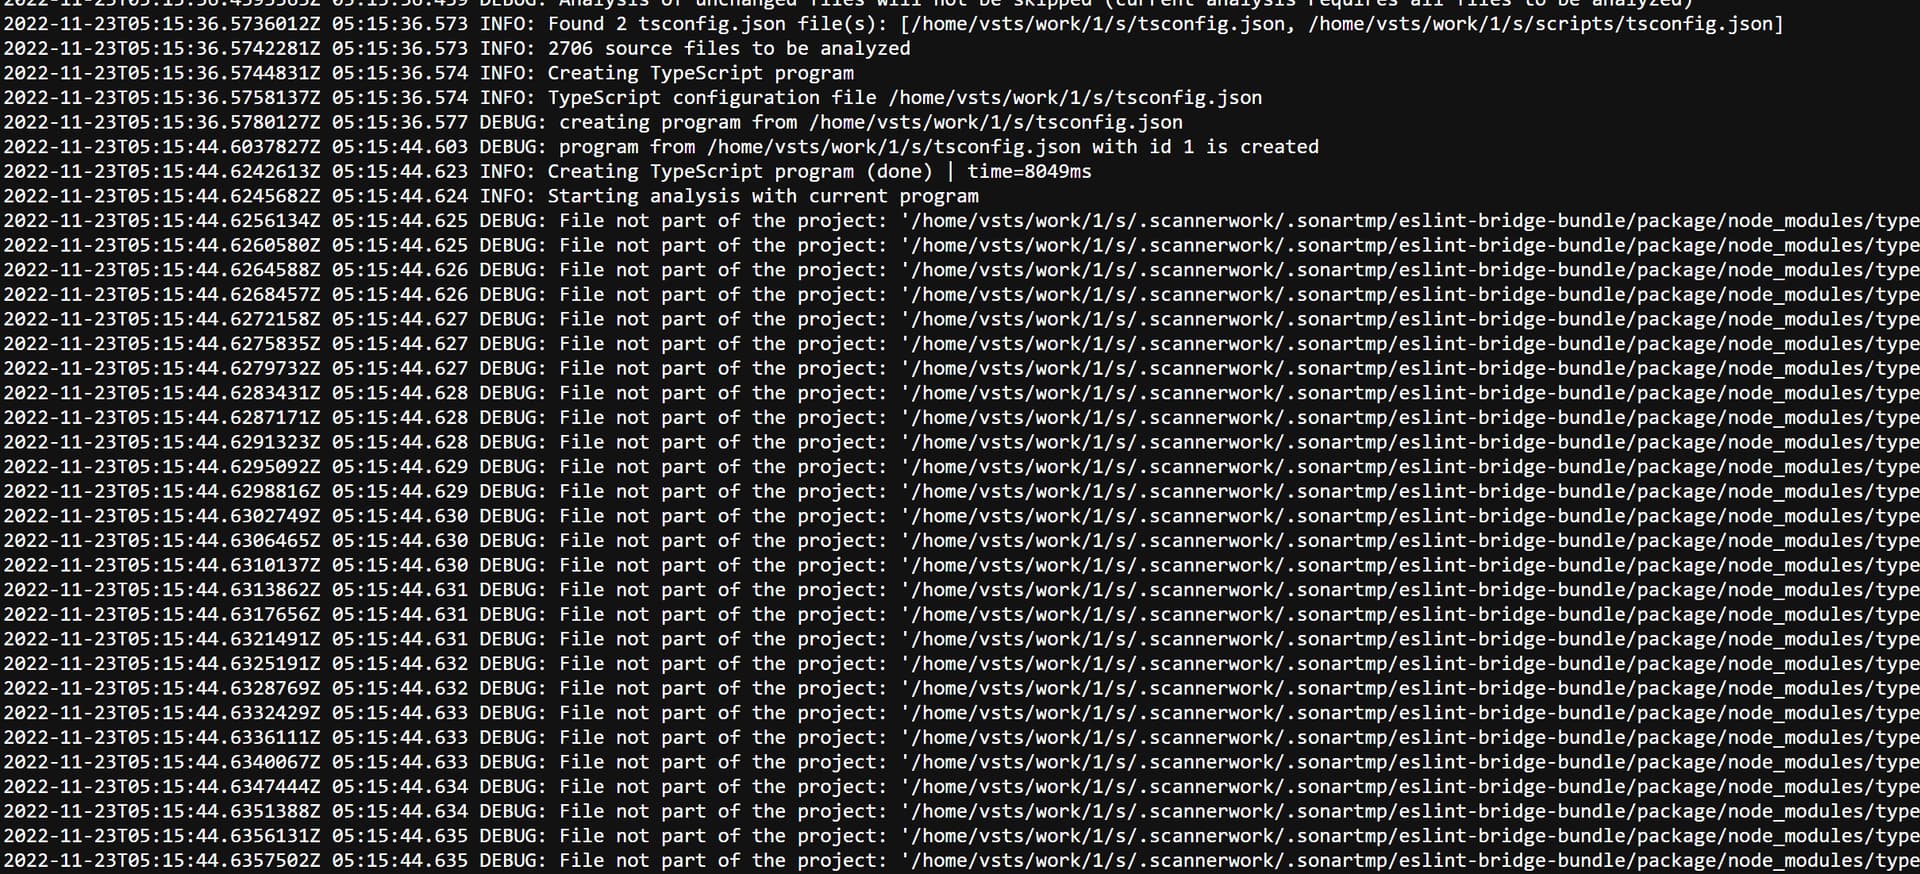
Running analysis in verbose mode shows this error.
10:36:04.512 DEBUG: Adding stub module wreck

10:36:04.512 DEBUG: Adding stub module wrench

10:36:04.513 DEBUG: Adding stub module write

10:36:04.513 DEBUG: Merged with previously registered stub module 'write'

10:36:04.514 DEBUG: Adding stub module xar

10:36:04.516 DEBUG: Adding stub module xml-escape

10:36:04.516 DEBUG: Adding stub module x-ray

10:36:04.516 DEBUG: Adding stub module yesql

10:36:04.516 DEBUG: Adding stub module zdf

10:36:06.345 DEBUG: Did not expect to visit symbol class com.sonar.security.E.D.B.M with argunsubscribe .

10:36:06.346 DEBUG: Did not expect to visit symbol class com.sonar.security.E.D.B.M with argunsubscribe .

10:36:06.596 DEBUG: Did not expect to visit symbol class com.sonar.security.E.D.B.M with argpadEnd .

10:36:06.596 DEBUG: Did not expect to visit symbol class com.sonar.security.E.D.B.M with argpadEnd .

10:36:07.921 DEBUG: Did not expect to visit symbol class com.sonar.security.E.D.B.M with argtest .

10:36:07.921 DEBUG: Did not expect to visit symbol class com.sonar.security.E.D.B.M with argtest .

10:36:11.198 DEBUG: Did not expect to visit symbol class com.sonar.security.E.D.B.M.

10:36:11.207 DEBUG: Did not expect to visit symbol class com.sonar.security.E.D.B.M with arglength .

10:36:11.207 DEBUG: Did not expect to visit symbol class com.sonar.security.E.D.B.M with arglength .

10:36:11.208 DEBUG: Did not expect to visit symbol class com.sonar.security.E.D.B.M with arglength .

10:36:11.208 DEBUG: Did not expect to visit symbol class com.sonar.security.E.D.B.M with arglength .
Increased SONAR_SCANNER_OPTS to -Xmx4048m (wanted this to be 4G but just replaced from 2048) and the analysis was completed successfully but took a really long time to complete.
Past runs would take around 12-13 min, this time it took more than 26 min.
See below for previous and current run comparison
Before:
INFO: Sensor JsSecuritySensor [security] (done) | time=558942ms
.
.
.
INFO: Analysis total time: 11:32.345 s
INFO: ------------------------------------------------------------------------
INFO: EXECUTION SUCCESS
INFO: ------------------------------------------------------------------------
INFO: Total time: 11:42.393s
INFO: Final Memory: 1006M/1736M
INFO: ------------------------------------------------------------------------
Finishing: Run Code Analysis
After
INFO: Sensor JsSecuritySensor [security] (done) | time=1303568ms
.
.
.
INFO: Analysis total time: 26:53.355 s
INFO: ------------------------------------------------------------------------
INFO: EXECUTION SUCCESS
INFO: ------------------------------------------------------------------------
INFO: Total time: 27:06.658s
INFO: Final Memory: 2736M/4048M
INFO: ------------------------------------------------------------------------
Finishing: Run Code Analysis
After 22nd Nov 2022, it seems like it’s taking awful long time to complete JsSecuritySensor.
thank you for the detailed logs and investigation.
With the previous release, we added new built-in support in the security analyzer for over 200 JS libraries. Depending on what libraries your code is using, it might be that the analysis is much more detailed now, and needs more resources.
How big is your project? how many lines of JS/TS code does it have?
Thanks for explaining. It’s an Angular project with 270,458 lines of code. We are only scanning the src/app folder.
Is there a way we can disable libraries that we don’t need to use? or will that have to be per rule?
Having support for all libraries is great, but that adds a significant amount of time to the pipeline builds.
Thanks for the information. 270k lines of code is not small, but the more than doubling of analysis time would be interesting to understand to see if there is a valid reason behind it or not.
Understandable. Unfortunately, there is no way of disabling support for specific libraries. Only complete rules can be activated/deactivated.
Yeah, 270k is not small and this will keep growing. But considering that 200+ rules were introduced in the background and overnight the analysis time has doubled. Is there a way we can check what rules are causing these?
We have added spec files to the source exclusion list but can add them to test exclusions too and check.
Considering the build times in the pipeline, we have currently paused analysis and 40+ minutes is not ideal. Would really appreciate it if you could help us with analyzing why it’s taking so long.
Was looking at raw logs and noticed that the scanner is going through node_modules but we have explicitly set the analyzer folder to src/app ~ cliSources: src/app
Those debug log messages do not indicate that the files are also scanned. To be sure, you can also add **/node_modules/** to the exclusions list.
Since this seems to be happening during the security analysis, a possibility is to try out the analysis with different rules out of this list deactivated in the used profile (when you deactivate in the JavaScript profile, you should also deactivate in the TypeScript profile to be sure).
If this doesn’t help, to further investigate if the time increase is due to a regression, I’ll need a way to reproduce this. If your project is not open-source, would you be willing to share some intermediate representation files created by the scanner during analysis in its working directory? (we can do that in a private thread).
@Karim_El_Ouerghemmi Thanks, I haven’t disabled rules from the list above, but I have disabled plenty of rules that do not apply to our Angular project. Rules for aws, react, chai, mocha etc. Yet, analysis takes the same amount of time.
I will go and create a new test profile and disable the rules from the list mentioned above and see if that help.
If not, we will have to get into a private discussion on improving the analysis. Our project is not open source, and unfortunately, we won’t be able to share any of the repo but we can provide any logs generated by sonar.
@Karim_El_Ouerghemmi also, noticed that since this issue was raised. Every pull request is running analysis on the whole repo and not just the changed files as it used to and that’s is probably why we have started to run into memory issues and very long running analysis.
We haven’t changed anything in terms of configuration in the pipeline, so wondering if this is an issue at SONAR’s end.
Let me know if there is a way to configure analysis only on changes files in a pull request.
@Karim_El_Ouerghemmi For example, a recent pull request only had two files, it recorded in sonar correctly that the code to check if for just these two files.
Would you mind taking a look at this issue. I’ve noticed that you have been most active and while I’ve been trying to resolve other issues, most of your replies have helped.
We are at a stage where sonar is not running anymore for pull requests because of how long it takes to run, we will now only be running it once a day but that defeats the purpose of code analysis.
Ok, so going through more community questions, it seems like incremental analysis is not possible, and sonar will, regardless analyze all files. So assuming, this is not the issue since this would have been the case before too.
So looks like it is the security analysis that is significantly slowing analysis. Are these rules recently added or what has changed in the last few weeks that has doubled the time?
I’ve disabled all rules along with few as mentioned above using a temp profile and analysis has come down to 5min for the whole project.
indeed, the sensor that is taking most of the time in your case is the security analysis sensor. Currently, security analysis does not make use of incremental analysis. Research on this topic is ongoing on our side.
As mentioned above, the JS security analysis was recently significantly improved in regards to understanding interaction with external libraries in code. It could be that parts of the code that were not explored before because they were not understood by the analysis engine, are now, and hence the analysis is more complete and precise. This is could explain an increase of ~10 minutes on a code base of ~270k LoC.
Nevertheless, we monitor and take this kind of report seriously. We want to verify that the time increase is not a regression. To do this best, we need a way to reproduce the situation. Since we cannot access the code in your situation, one way to help us investigate would be to share with us privately the files created in the working directory .scannerwork/ucfg2/js when the scanner runs. These files are an abstraction of the source code on which the security analyzer can run. There is no way to retrieve the original source code from these files. Let me know if you are willing to share these, I would open a private thread with you in that case.
Thanks, although disabling these rules is an option but is that a recommendation? We will check details of these rules and enable them accordingly.
But, since this was a recent change and it broke existing analysis and doubled the time, it seems to be a regression and 22 days is quite a long time for resolution and not having analysis run.
I am glad it’s resolved and the issue has been found.
Is there a way to specific or override a quality profile used for a project? An option would be to have these rules disabled for pull requests but have it enabled for a full analysis that runs ever night.