Code Smell Count mismatch between SonarQube Server and SonarLint Eclipe IDE

Hi,

We’re trying Analyze the code from local Eclipse IDE, but the “Code Smell” Count doesn’t match for some files. However, the specific rule is enabled in both the SQ Server and Eclipse IDE - project bindings are also successfully mapped. Could someone help further.

Config Details:
SonarQube - V8.2 Developer Edition
Scanner - 4.5.0.2216
IDE - Eclipse Java EE IDE for Web Developers. Version: Mars.2 Release (4.5.2)
Plugin - SonarLint 5.5.0

When I analyze file with verbose log enabled, it had reported not much info except Could not complete symbolic execution - according to the below, it says that it is harmless and can be avoided https://stackoverflow.com/questions/34065727/error-could-not-complete-symbolic-execution-reached-limit-of-10000-steps

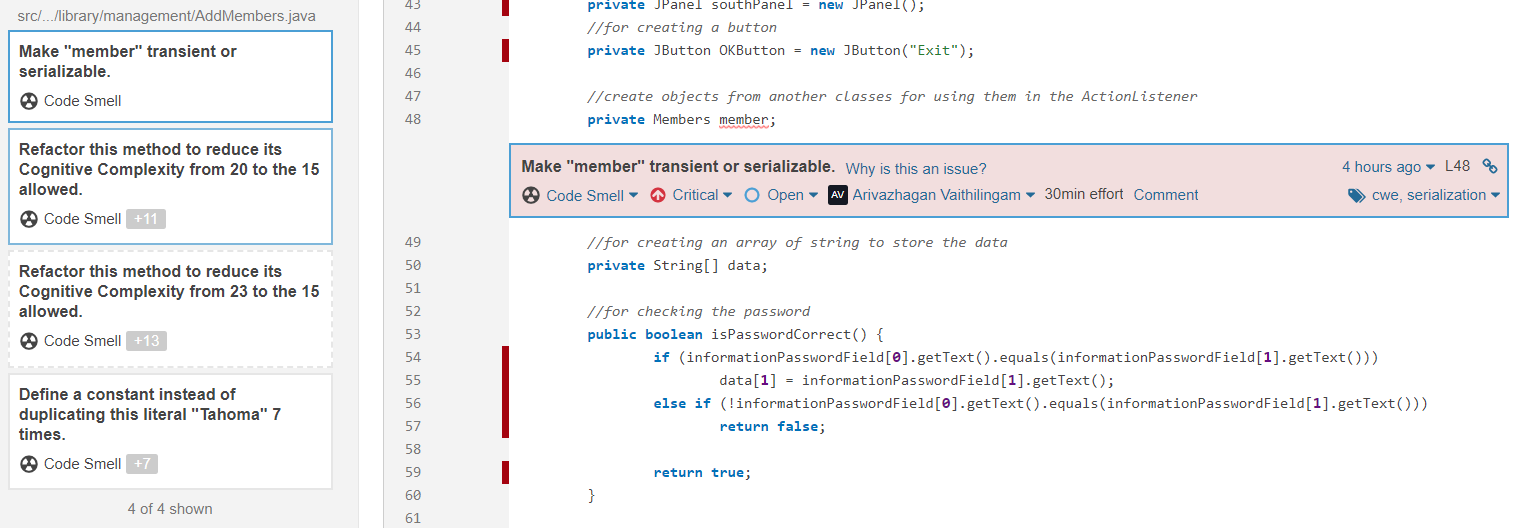
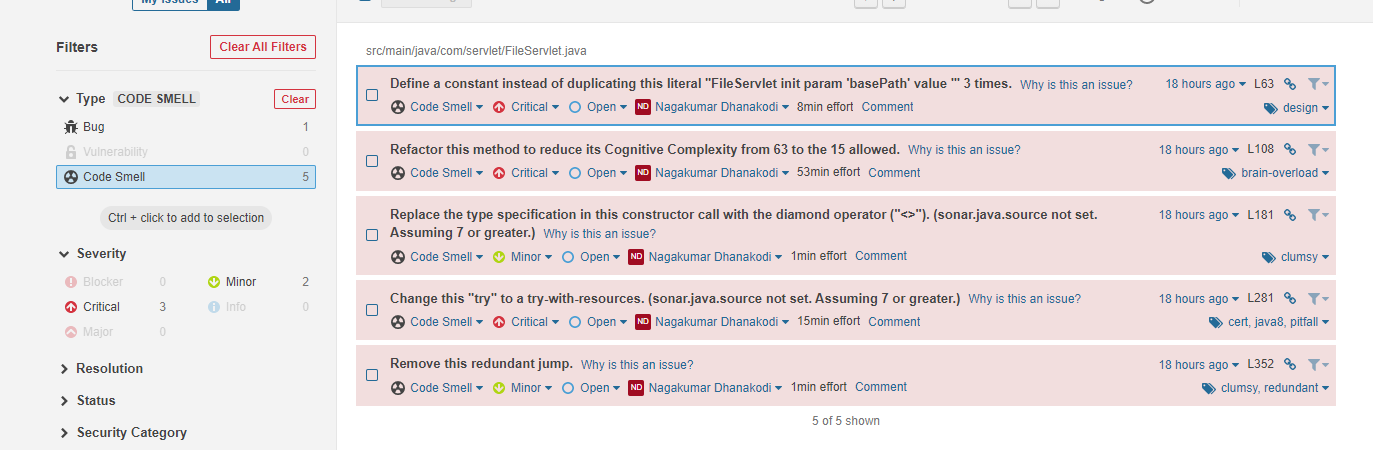
Some of Java Rules not validated in Eclipse are: S2259, S3252, S1751 and there are few more other than these which are enabled in SonarLint but not reporting the ‘Code Smell’ which SQ has reported.

Attaching SonarLint Verbose logs:
SonarLintLog.txt (60.3 KB)

Further help would be much appreciated. Thanks

Hi @ariv1983

Maybe this is another consequence of https://jira.sonarsource.com/browse/SLE-348

Can you tell us the JDK versions you are using:

  • to run the SonarQube analysis (for example if you use the Maven scanner, this can be displayed with mvn -v)
  • to run Eclipse (can be visible in About -> Installation details -> Configuration -> java.runtime.version)
  • to compile your project in Eclipse (in project properties -> Java build path -> Libraries -> JRE System Library)

Hi @Julien_HENRY

Thanks for the reply - please find the details below:

JDK Versions for

  • SonarQube Analysis - 1.8.0_181
  • Eclipse - 1.8.0_181-b13
  • Projects in Eclipse - Java SE-1.8

Hi,

If the JDK is the same everywhere, it should be a different issue. Would you be able to share a small reproducer (small project, or even a simple Java class) that raises issues on SQ but not in SonarLint?

Hi @Julien_HENRY
Apologies for the delay!

I’m attaching two screenshots, where Rule: “Throwable.printStackTrace(…) should not be called” is caught at one file and another file it is NOT and both the files are from the SQ server. This seems to be a new find - however, we’re trying to replicate the issue with a generic file to share.

Meantime, please let us know if you find anything with the screenshot.

thanks in advance,
Ariv

Hi,

Hard for us to investigate with only a partial screenshot. Could you please share a sample project on GitHub for example, with the two source files and the procedure to reproduce on a clear SonarQube instance.

Thanks

Hi @Julien_HENRY

I have created a GitHub project: https://github.com/ArivRedgrape/sonar-poc.git included with a ‘Jenkinsfile’ which has the code for sonar execution.

We had tried to run this project in our Sonar server which had variations in the report.
e.g this file: https://github.com/ArivRedgrape/sonar-poc/blob/main/src/main/java/com/library/management/AddMembers.java is a sample. Sonar Server has reported 4 Critical issues, however local Eclipse IDE reported only 3 Critical issue and below is the missing issue:
“Make “member” transient or serializable” is not reported in the local IDE

Attaching screenshots:
Eclipse IDE:

SonarServer:

Please let me know for any further queries. Thanks

I don’t reproduce with the latest version of SonarLint (not in connected mode) so I guess the issue come from the version of the Java analyzer that is installed on your SonarQube server.
Can you let me know what is the version of the sonar-java-plugin your have on your server? You can call http://yoursqserver/api/plugins/installed to find the version.

  • description: “Code Analyzer for Java”,
  • version: “6.3.2 (build 22818)”

Also, have managed to push this project to SonarCloud: https://sonarcloud.io/project/issues?fileUuids=AXZ6FzvtAPOuobjaqx75&id=Sonar_Poc_Local&resolved=false&severities=CRITICAL
with the mismatch of the ‘Critical’ issues count.

Hello,

Thanks for providing all those details.

I managed to reproduce it locally and understand what was going on. We will probably have to provide a fix on our side. I just opened a ticket here.

If you encounter this problem you probably have the “Build automatically” option disabled on your project (in the Project menu). Could you try activating it, and close then open your source file to re-trigger an analysis ? This could be a temporary workaround.

We don’t plan to work on this at least before next year.
Hope this helps, keep me informed if it worked on your side.
Damien

Thanks much for the confirmation - workaround is working as expected!

1 Like

Hi @Damien_Urruty

In continuation of the issue, we were trying the same with our actual code base but we are still seeing the count mismatch. So, I have moved a sample file to GitHub: https://github.com/ArivRedgrape/sonar-poc/blob/main/src/main/java/com/servlet/FileServlet.java

Also, have tried to analyze this project in SonarCloud - but, the count is mismatching between the SonarCloud and Sonar Server report:
SonarCloud: https://sonarcloud.io/code?id=ArivRedgrape_sonar-poc&selected=ArivRedgrape_sonar-poc%3Asrc%2Fmain%2Fjava%2Fcom%2Fservlet - Reported 6 CodeSmells whereas our SonarServer reported only 5 CodeSmells

And, below is the screenshot of the count from SonarLint:

This is from SonarQube server:

Hi!

The difference between SonarCloud and SonarQube is expected. As you mentioned at the beginning of the thread, you use SonarQube 8.2 and Java analyzer 6.3.2, which is older than what is installed on SonarCloud (where in general analyzers are up-to-date).

If I check this more in detail, Ii can see that SonarCloud raises the “Replace this alternation with a character class.” code smell. If you click on “Why is this an issue ?”, you will see that this rule is available since Dec 15, 2020, so it is a very recently introduced rule, that is probably not present on your SonarQube server.

So now if I try to summarize, for the FileServlet.java file, SonarLint raises 9 issues, SonarCloud 10 (the +1 is explained above) and SonarQube only 6 ?

How did you add the javax.servlet dependency ? If I clone your repo, the classes in javax.servlet.* package are not found, which could explain why issues are not raised. Usually they are available in Java EE (not Java SE as you mentioned), or by adding a third-party dependency like Tomcat.

When I try locally (project bound to your SonarCloud project), I can see only 7 issues. I suspect that it is due to this dependency issue on javax.servlet APIs. You probably have the same issue when you analyze with the scanner.

I had a look at your Jenkins file, and I can see that you invoke the scanner directly. It’s easy to forget or misconfigure a property, so I recommend you use the Scanner for Maven instead, it will simplify your Jenkinsfile and maybe fix those errors. Also please make sure that you have the javax.servlet APIs available, either by using Java EE when invoking the scanner, or by adding the necessary third-party dependency to your Maven file.

Hope this helps,
Please keep us informed
Damien

Hi - Thanks for the quick reply
Apologies - I missed to commit the dependency changes done in pom.xml, it’s updated now. We are worried about the count mismatch between sonar server and sonar lint.

I have my local workspace clean inlcuding the FileServlet.java but still having the 9 issues - meantime I will try with ‘Scanner for Maven’ - Thanks!

I updated my local copy of your project and I now have 10 issues as on SonarCloud (I am connected with it).

So in the end it’s really related to the way you configure the analysis with SonarQube. By having another look at your Jenkinsfile, you probably miss the sonar.java.libraries property, which is supposed to hold all the paths to your dependency jars. This is normally handled automatically by the Scanner for Maven, that collects the dependencies declared in the pom file, so I really recommend to migrate.

Could you try to use it and keep us informed ?
Thanks
Damien

Hi @Damien_Urruty

In reference with the Github project, there are no dependency JAR libraries - so have pointed to the ‘classes’ directory. Apart from these, have implemented ‘Scanner for Maven’ approach and configured the values in ‘pom.xml’.
After the above changes, have created a build and analyzed using our Sonar Server which has reported only 5 Code Smells - at the same time, with the updated project binding to SonarLint showed 9 Code Smells.
However, before sonarserver bindings (disconnected mode) showed 10 code smells in SonarLint. I was under the assumption that since the bindings/rules are downloaded from SonarServer it will be matching according to the rulesets defined in the server(haven’t modified with the default sonar settings though). Please take a look at the pom.xml/Jenkinsfile for further improvements.

Thanks
Ariv

Hello Ariv,

You don’t need to set sonar.java.binaries and sonar.java.libraries when using Scanner for Maven. They are automatically set. If you customize them, you lose default configuration.

Could you try to remove those 2 properties from pom.xml ?

Also be careful because you changed your projectKey, so this has probably duplicated the project on SonarQube.

Thanks
Damien

Hi @Damien_Urruty

Have removed those 2 properties from pom.xml and I’m deleting the project from the SonarQube Server before pushing any major change to the project settings to get a fresh report.

Changes are made and committed to GitHub and analysis as well - this time ‘Issues’ count is 15 :frowning:

Thanks,
Ariv

So now you have more issues in SonarQube than in SonarLint, right ?

For some issues like “Refactor this code to not place tainted, user-controlled data in header”, this is expected. As you can read in our FAQ:

Vulnerabilities raised by the Taint Analyzer (SQL Injection, …) are issues detected in SonarQube commercial editions that are also not detected by SonarLint (rule key starting by javasecurity , phpsecurity or roslyn.sonaranalyzer.security.cs ). Running tainted analysis in the IDE is currently not practical mainly for performance reason.

I think if you subtract the taint vulnerability issues, the count should match what you observe in SonarLint.

Could you confirm ?
Thanks
Damien

You’re right :slight_smile:
if I exclude those ‘tainted rule’ the counts are maching between SonarLint and SQ Server. This makes us to conclude with some assumptions:

  1. Does this mean it is not valid to expect the counts to be matching for every files between SL & SQ?
  2. What will happen when the vice versa happens ie. SL produces more count than SQ - developer will spend time to fix a issue which are not going to be reported by SQ.

We were planning to make the ‘build failure’ if a developers (New) code introduces any new issues with his respective branch. In this scenario(FileServlet.java), though this issues (tainted) not reported in SL it will still make the build failure (since it is reported only in SQ) and the developer will be nowhere to fix it to push his branch back to the main branch.

Please advice us for any further better approach. Thanks