I run a CI pipeline for a dotNet app
- CI system used
Azure DevOps server on prem SQ 9.8
Code coverage configured and I get different results on both sides
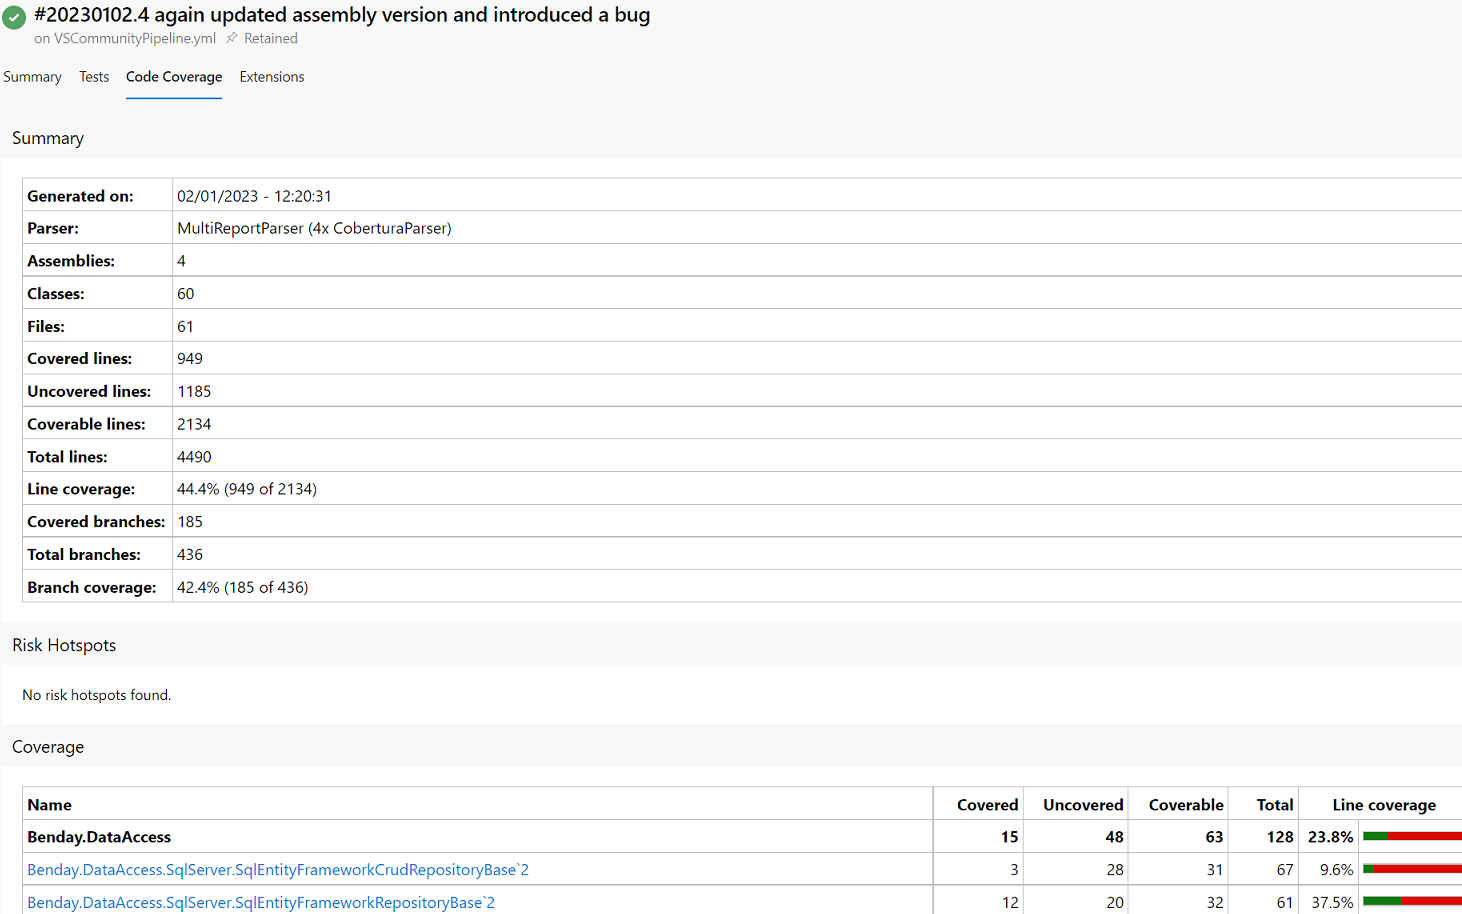
when I check coverage in the Azure Devops build summary I see coverage percentage which is 44.4% (949 of 2134)
whereas In SQ, I 58.3%

I see same number of uint tests on both sides
Here is the config of the SQ prepare task in the pipeline
t
ask: SonarQubePrepare@5
  enabled: true
  inputs:
    SonarQube: 'SQGlobalConn'
    scannerMode: 'MSBuild'
    projectKey: 'ps-presidents-ci-vsComm'
    projectName: 'ps-presidents-ci-vsComm'
    extraProperties: |
      sonar.cs.vstest.reportsPaths= $(Build.Repository.LocalPath)/test/*Tests/TestResults/*.trx
      sonar.cs.vscoveragexml.reportsPaths=$(Common.TestResultsDirectory)/myfile.coverage.xml
      sonar.dependencyCheck.securityHotspot=true
      sonar.dependencyCheck.jsonReportPath=$(System.DefaultWorkingDirectory)/dependency-check-report.json
      sonar.dependencyCheck.htmlReportPath=$(System.DefaultWorkingDirectory)/dependency-check-report.html
      sonar.coverage.exclusions = **/*.js,**/*.json,**/*.xml,**/*.png,**/*.sh,**/*.h,**/*.m,**/*.c,**/*.cpp,**/*.pdf,**/*.plist,Pods/**/*
      sonar.swift.excludedPathsFromCoverage=.*Tests.*
I went through a thread here at
Code Coverage Metrics not matching Azure DevOps - SonarCloud - Sonar Community (sonarsource.com)
but not sure I understand what I need to do more that the config I have so I woued eike to see same resuets on both sides