mmisztal
March 21, 2025, 1:36pm
1
ALM used: Azure DevOps
CI :Azure DevOps
Scanner command used when applicable: SonarCloudAnalyze@2 & SonarCloudPublish@2
Languages of the repository: C#
Only if the SonarCloud project is public, the URL: SonarQube Cloud
Error observed:
We’re getting an error stating that the “bridge server is unresponsive”. The issue has persisted for the better part of the last 2 days.
Steps to reproduce: Run any pipeline containing the Sonar steps.
Potential workaround: Disabling sonar, but that’s not the point
ganncamp
March 24, 2025, 3:44pm
2
Hi,
Welcome to the community!
Can you try increasing sonar.javascript.node.maxspace ?
mmisztal
March 25, 2025, 10:19am
3
Hi, how do I do that on Azure DevOps? I don’t think the tasks have this documented? What value should I increase it to? The VM running the build is a ~14GB VM
ganncamp
March 25, 2025, 11:56am
4
Hi,
Did you check the docs link in my previous post?
ganncamp
March 25, 2025, 1:19pm
6
Hi,
Well for a pure .NET project you wouldn’t need this at all
More seriously, this is not something I would bump proactively on most projects unless you know going in that you’ll have a lot going on with JS/TS analysis.
mmisztal
March 25, 2025, 1:25pm
7
Yeah it’s related to a JS/TS project. What is the default value being used btw?
ganncamp
March 25, 2025, 1:27pm
8
Hi,
I’m not sure off-hand. The docs recommend
Set this property to 4096 or 8192 for big projects.
Given that doubling, I would guess the default is 2048, but that’s only a guess.
mmisztal
March 26, 2025, 9:32am
9
We’ve tried setting the values you’ve prescribed, and changed the build agent vm to a 3x core / 14GB RAM image. It didn’t help. The issue persists.
I’m going through the docs again. Is there anything else you could recommend?
ganncamp
March 26, 2025, 12:17pm
10
Hi,
Can you share the full analysis log?
The analysis / scanner log is what’s output from the analysis command. Hopefully, the log you provide - redacted as necessary - will include that command as well.
This guide will help you find them.
mmisztal
March 26, 2025, 12:22pm
11
I’ll get to that today. I’ll update when I have the log
1 Like
Hello, I’m attaching the log from a recent execution, as well as the SonarCloudPrepare step which is running prior to the analysis.
  - task: SonarCloudPrepare@3
        inputs:
          SonarCloud: <redacted>
          organization: <redacted>
          scannerMode: cli
          configMode: manual
          cliProjectKey: $(Build.Repository.Name)
          cliSources: src
          extraProperties: |
            sonar.verbose=true
            sonar.exclusions=**/node_modules/**
            sonar.test.inclusions=**/*.(spec|test).*
            sonar.coverage.exclusions=**/*.(spec|test).*
            sonar.javascript.lcov.reportPaths=$(lcovReportPath)
            sonar.javascript.node.maxspace=8192
        displayName: Sonar config
sonar.log (1.3 MB)
ganncamp
March 26, 2025, 6:24pm
13
Hi,
Thanks for the log.
1525 files indexed
Your project is really big. You may need to just keep doubling the memory allocation until it works.
I’ve noticed that the scanner and JVM use 3GB RAM each. Is this a potential factor?
Also, the scanner suddenly stopped working after a developer added ~10 LoC in a PullRequest. Up until then it was working fine under the default settings. I’m not entirely sure if the doubling strategy is the correct way to go here
ganncamp
March 27, 2025, 11:51am
15
Hi,
What were those 10 LoC? Were they particularly complex?
No, not really.
One class was added to an import statement in TS, and some simple business logic was modified.
ganncamp
March 27, 2025, 12:44pm
17
Hi,
It may be that you hit a tipping point. Have you tried the doubling strategy?
Our agent is a 14GB VM from the Azure Pipelines macos-latest pool.8192 then we will exceed it’s memory limit.
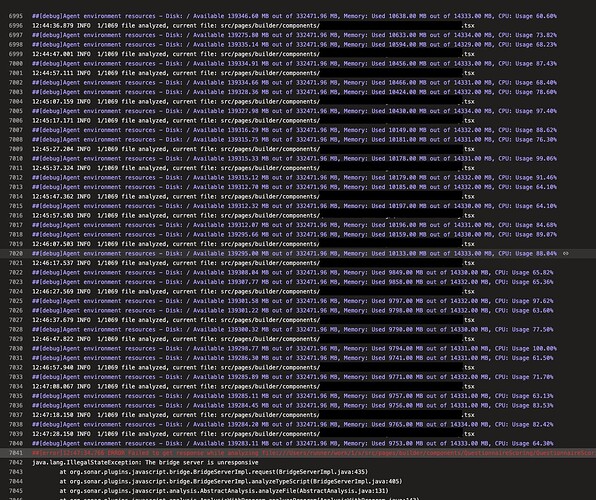
At the moment, it appears that running the analysis utilizes 10GB out of the 14GB RAM, irregardless of the sonar.javascript.node.maxspace setting.
Our current configuration is:
      - task: SonarCloudPrepare@3
        inputs:
          SonarCloud: <redacted>
          organization: <redacted>
          scannerMode: cli
          configMode: manual
          cliProjectKey: $(Build.Repository.Name)
          cliSources: src
          extraProperties: |
            sonar.sources=src
            sonar.verbose=true
            sonar.sourceEncoding=UTF-8
            sonar.javascript.lcov.reportPaths=$(lcovReportPath)
            sonar.javascript.node.maxspace=4096
            sonar.inclusions=**/*.ts,**/*.tsx
sonar.exclusions=**/node_modules/**,**/dist/**,**/*.test.ts,**/*.test.tsx,**/__tests__/**
We’ve managed to get the indexed files down to 1069
This is during a PR analysis. Interestingly it gets stuck at the 1st file - which was the file modified during the PR
