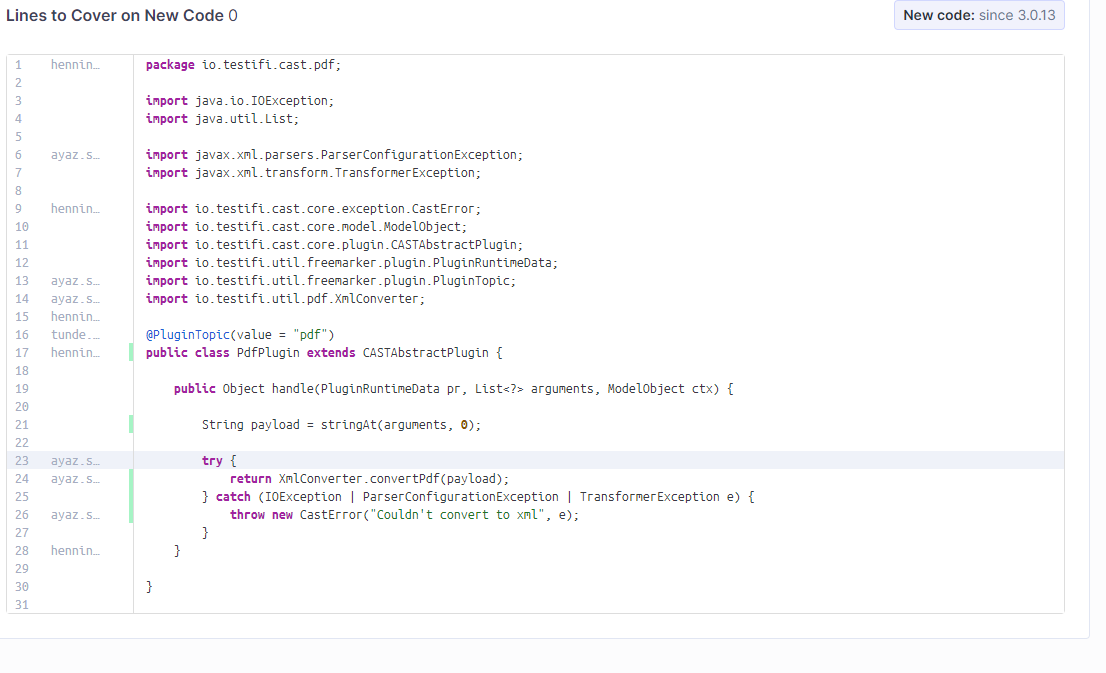
When a project is completely covered by tests the branch coverage seems to be not returned. So the caller doesnt know if the coverage is good or just not calculated
Hi,
I’m not sure we’ve ever gotten far enough in coverage to see this error. ![]()
Could you provide some screenshots or the Web API call where you’re seeing this?
Thx,
Ann
Microservice style with project of 120 lines and some tests ![]() Will gather those infos from the team
Will gather those infos from the team
Hi,
The URL doesn’t work for me, so it must be a private project. Oh well. Thanks anyway for providing it.
For the screenshots, other than getting a 0 for Lines to Cover, this all looks okay to me. What part of it do you think is wrong?
Ann
Just the branch coverage is missing in the api call and in the overview. expected is that it return 100% branch covered
Or another question regarding this. We have Overall coverage, line coverage and branch coverage. A line can have multiple branches so when we have an overall coverage of 100% both the line and the branch must also be 100% , right? So i would guess the developers hiding some redundant information here which of course the client need to imply by himself and code it on top of just receiving the data and show as it is
Hi,
Actually, I just pulled up one of our own projects to see which metrics were listed for it. I accidentally landed on one that happens to have 100% coverage (color me surprised!) and our listing is fuller than yours:
So this seems not to be about 100% coverage but about your unique case.
So I’m going to call in more expert eyes.
Ann
But it looks a bit the same. As soon as there are 0 Conditions to cover, the Condition coverage is missing. When not all coverd:

im also a bit confused with the conditions/branches . there was a time where it all was called branch, boolean and exception catch branch. might be the catch of exception is not there anymore
Hi,
Look at the top section of my screenshot: the Coverage on New Code section shows coverage of 100%, with uncovered conditions of 0, and 0 conditions (still left?) to cover.
I think something’s going wrong (or wronger) in your particular case. To be honest, I find “0 lines to cover” and “0 conditions to cover” very odd. I would expect those to be the numbers of cover-able lines and conditions, not what’s left to do. So that’s wrong too IMO, but you have this additional wrong thing of metrics not showing up.
And I’ve flagged this for the team, so hopefully they’ll handle all the wrongness at once. ![]()
Ann
that 0s are for new code, which doesnt exist in the timframe it seems
but the overall code shows the line, and the catch is catching 3 different exceptions, so i would expect branches to exist for it
@Henning_Luther So to summarize the issue, do you mean to say that the branch coverage is missing for the overall code?
yes. i mean i dont see any coverage and also not even existing branches. i would expect for every exception cath to be one branch. but i might be wrong. and if there are no branches the question might be, is the coverage not existent or 100%
Hey so sorry for not getting back to this thread. I would like to know more about this issue. I can explain a few scenarios and let me know if that helps:
- I change a part of code, say a configuration file. The analysis tell me there are no coverage information as this file is not part of coverage in tests. This is expected
- I change a few lines of code which doesn’t have any conditions. I would expect line coverage on this and no conditional coverage as this seems unnecessary
- I added few conditions in my code. I would expect conditional coverage to be returned
I think in the end it would also come to the coverage report you are using. Let me know if this helps
i will have a look again later, since i already forgot about it ![]()


