Hi Team,
I am trying to publish my Karma test coverage to SonarQube Dashboad.
I have number of unit test written and all are fine. I am also able to generate coverage report.
But When I run “npm run sonar” command, I am getting below logs & output :-
$ npm run sonar

> order-management-ui@0.0.0 sonar C:\Users\316954\Work\Project\Git Projects\One Platform\Order Processing\order-management-ui-final\Sonar CB View\ordnrt_cbview_v1_ui
> sonar-scanner

INFO: Scanner configuration file: C:\Users\316954\Work\Project\Git Projects\One Platform\Order Processing\order-management-ui-final\Sonar CB View\ordnrt_cbview_v1_ui\node_modules\sonar-scanner\bin\..\conf\sonar-scanner.properties
INFO: Project root configuration file: C:\Users\316954\Work\Project\Git Projects\One Platform\Order Processing\order-management-ui-final\Sonar CB View\ordnrt_cbview_v1_ui\sonar-project.properties
INFO: SonarQube Scanner 3.1.0.1141
INFO: Java 1.8.0_241 Oracle Corporation (32-bit)
INFO: Windows 10 10.0 x86
INFO: User cache: C:\Users\316954\.sonar\cache
INFO: SonarQube server 6.0
INFO: Default locale: "en_US", source code encoding: "UTF-8"
INFO: Load global repositories
INFO: Load global repositories (done) | time=2524ms
INFO: User cache: C:\Users\316954\.sonar\cache
INFO: Load plugins index
INFO: Load plugins index (done) | time=598ms
INFO: Process project properties
INFO: Load project repositories
INFO: Load project repositories (done) | time=712ms
INFO: Load quality profiles
INFO: Load quality profiles (done) | time=509ms
INFO: Load active rules
INFO: Load active rules (done) | time=4110ms
INFO: Publish mode
INFO: -------------  Scan ordnrt_cbview_v1_ui
INFO: Load server rules
INFO: Load server rules (done) | time=2315ms
INFO: Base dir: C:\Users\316954\Work\Project\Git Projects\One Platform\Order Processing\order-management-ui-final\Sonar CB View\ordnrt_cbview_v1_ui
INFO: Working dir: C:\Users\316954\Work\Project\Git Projects\One Platform\Order Processing\order-management-ui-final\Sonar CB View\ordnrt_cbview_v1_ui\.scannerwork
INFO: Source paths: src
INFO: Test paths: src
INFO: Source encoding: UTF-8, default locale: en_US
INFO: Index files
INFO: Excluded sources:
INFO:   * * /node_modules/ * *
INFO:   **/ * .spec.ts
INFO:   **/ * .spec.ts
INFO: Included tests:
INFO:   **/ * .spec.ts
***INFO: 0 files indexed***
***INFO: 407 files ignored because of inclusion/exclusion patterns***
INFO: Sensor Lines Sensor
INFO: Sensor Lines Sensor (done) | time=1ms
INFO: Sensor SCM Sensor
INFO: Sensor SCM Sensor (done) | time=1ms
INFO: Sensor XmlFileSensor
INFO: Sensor XmlFileSensor (done) | time=1ms
INFO: Sensor Zero Coverage Sensor
INFO: Sensor Zero Coverage Sensor (done) | time=0ms
INFO: Sensor Code Colorizer Sensor
INFO: Sensor Code Colorizer Sensor (done) | time=0ms
INFO: Sensor CPD Block Indexer
INFO: Sensor CPD Block Indexer (done) | time=1ms
INFO: Calculating CPD for 0 files
INFO: CPD calculation finished
INFO: Analysis report generated in 76ms, dir size=14 KB
INFO: Analysis reports compressed in 20ms, zip size=5 KB
INFO: Analysis report uploaded in 469ms
INFO: ANALYSIS SUCCESSFUL, you can browse http://localhost:9000/dashboard/index/ordnrt_cbview_v1_ui
INFO: Note that you will be able to access the updated dashboard once the server has processed the submitted analysis report
INFO: More about the report processing at http://localhost:9000/api/ce/task?id=AXGDDLwTH0tCsBCo0X3v
INFO: Task total time: 12.669 s
INFO: ------------------------------------------------------------------------
INFO: EXECUTION SUCCESS
INFO: ------------------------------------------------------------------------
INFO: Total time: 21.069s
INFO: Final Memory: 8M/101M
INFO: ------------------------------------------------------------------------
Output :-
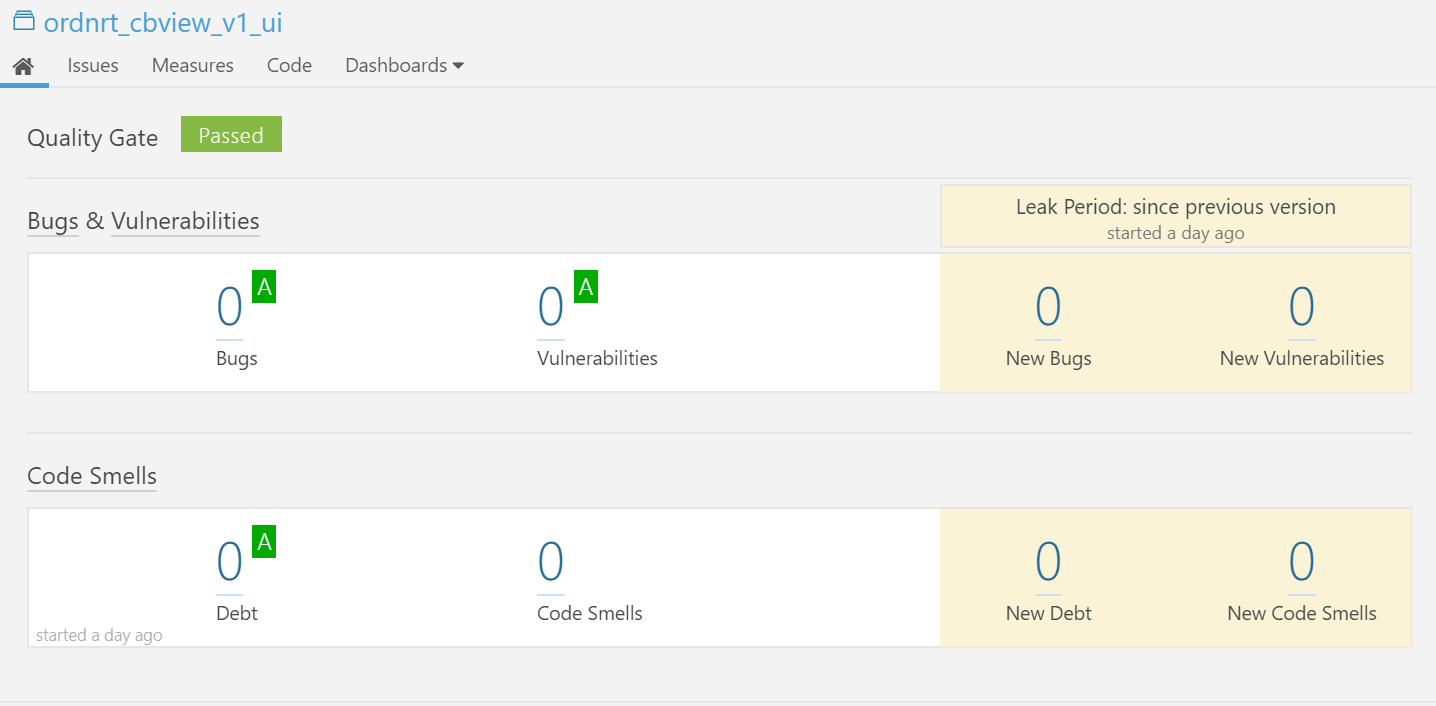
I am not getting why my files are not getting parsed.
Getting this in above log, so everything show 0%
***INFO: 0 files indexed***
***INFO: 407 files ignored because of inclusion/exclusion patterns***
sonar-project.properties :-
sonar.host.url=http://localhost:9000
sonar.login=developer
sonar.password=developer
sonar.projectKey=ordnrt_cbview_v1_ui
sonar.projectName=ordnrt_cbview_v1_ui
sonar.projectVersion=1.0
sonar.sourceEncoding=UTF-8
sonar.sources=src
sonar.exclusions=** /node_modules/** ,** /* .spec.ts
sonar.tests=src
sonar.test.inclusions=**/*.spec.ts
sonar.ts.tslintconfigpath=tslint.json
sonar.javascript.lcov.reportPaths=coverage/order-management-ui/lcov.info
I have also created simple POC with angular 8, but still same issue.
Could someone please help me, this is urgent .
Thanks !


