The new log shows you’re still using SonarScanner, instead of SonarScanner for .NET. Please see the link I provided above for the scanner and how to use it.
Additionally, I see this:
simple 01-Aug-2022 13:45:12 Skipping execution of task 'OpenCover dotnet' as it is disabled
And in fact, the ‘-’ in the screenshot you provided indicates that no coverage reports were provided to analysis.
As noted earlier I did downloaded latest version Dotnet Sonar scanner and last log ran on dotnet scanner with the version sonar-scanner-msbuild-5.7.2.50892-net5.0.
If you noticed on script path:Development Tools\dotnet\tools*sonar-scanner-msbuild-5.7.2.50892-net5.0\sonar-scanner-4.7.0.2747\bin\sonar-scanner.bat*
Also “-” indicates no coverage report which means something I need to configure to generate coverage report
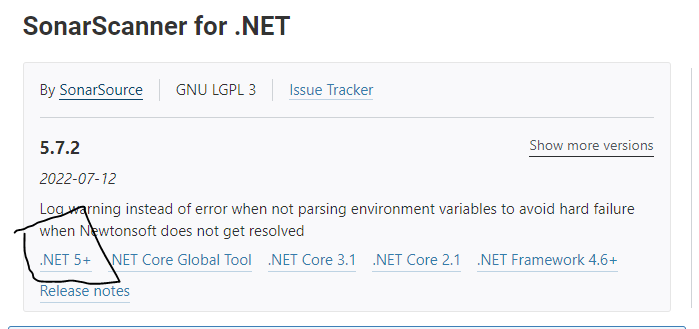
@ganncamp Sorry I’m not clear with earlier communitication, based on your recommendation I did downloaded below Sonascanner for .Net (version 5.7.2) installer from SonarScanner for .NET | SonarQube Docs and thats what I’ve configured to run this plan.
@ganncamp we have reviewed and it looks like all good and per your review and recommendation we are using Sonascanner for .Net (version 5.7.2) to build this sonar report and for some reason coverage report is not showing. Not sure where is the issues and how to troubleshoot further. Troubleshoot steps:
deleted project on sonar
recreated entire build plan on bamboo (CI/CD pipelines)
I tried manually and recieved below analysis successful but not generating report.
08:03:18.544 DEBUG: 'VRSK.PropertyReceiptAndAcceptance.CommonServices.Tests/Core/ExternalDapperServiceTest.cs' generated metadata with charset 'UTF-8'
08:03:18.556 DEBUG: 'VRSK.PropertyReceiptAndAcceptance.Service/Services/Submission/Impl/ExternalService.cs' generated metadata with charset 'UTF-8'
08:03:18.567 DEBUG: 'VRSK.PropertyReceiptAndAcceptance.Service/Services/Lookup/Impl/LookupService.cs' generated metadata with charset 'UTF-8'
08:03:18.579 DEBUG: 'VRSK.PropertyReceiptAndAcceptance.Service/Services/DBUpdates/Interface/IDBService.cs' generated metadata with charset 'UTF-8'
08:03:18.589 DEBUG: 'VRSK.PropertyReceiptAndAcceptance.Domain/Models/Customer/Customer.cs' generated metadata with charset 'UTF-8'
08:03:18.924 INFO: Analysis report generated in 1802ms, dir size=58 MB
08:03:23.107 INFO: Analysis report compressed in 4182ms, zip size=8 MB
08:03:23.108 INFO: Analysis report generated in E:\bamboo-agent-home\xml-data\build-dir\PEN-APCRAASRT-AAEJ\.scannerwork\scanner-report
08:03:23.108 DEBUG: Upload report
08:03:23.650 DEBUG: POST 200 https://codescan.verisk.com/sonar/api/ce/submit?projectKey=VRSK.PropertyReceiptAndAcceptance.API&projectName=Property.Claims.ReceiptAndAcceptance | time=541ms
08:03:23.653 INFO: Analysis report uploaded in 545ms
08:03:23.656 DEBUG: Report metadata written to E:\bamboo-agent-home\xml-data\build-dir\PEN-APCRAASRT-AAEJ\.scannerwork\report-task.txt
08:03:23.656 INFO: ANALYSIS SUCCESSFUL, you can browse https://code.verisk.com/sonar/dashboard?id=VRSK.PropertyReceiptAndAcceptance.API
08:03:23.656 INFO: Note that you will be able to access the updated dashboard once the server has processed the submitted analysis report
08:03:23.657 INFO: More about the report processing at https://code.verisk.com/sonar/api/ce/task?id=AYQ9X9yKAlndzg44ZdMI
08:03:23.659 DEBUG: Post-jobs :
08:03:23.663 INFO: Analysis total time: 34.523 s
08:03:23.667 INFO: ------------------------------------------------------------------------
08:03:23.668 INFO: EXECUTION SUCCESS
08:03:23.668 INFO: ------------------------------------------------------------------------
08:03:23.668 INFO: Total time: 36.862s
08:03:23.760 INFO: Final Memory: 29M/2424M
08:03:23.762 INFO: ------------------------------------------------------------------------
Sonarscanner version -sonar-scanner-msbuild-5.7.2.50892-net5.0 and below command to run the report. Also attached coverage.xml.
Have you looked at this log? There are over 5k lines of errors handling the coverage report. At a guess, you generate the report on a different file system than you run analysis on?
@ganncamp we have noticed Global server settings pointed to old sonarqube url. but I couldn’t identify where it was configured. can you please let me know how to change.
@ganncamp yes you are correct, can you please let me know how to update the global server settings to the correct url, in the log still shows wrong url. finally we have identify and resolved the issues, now coverage report is showing on sonar.
Issue resolution - working directory issues:
Marked “Working SubDirectory” field value as blank in sonar plan as coverage-report.xml will be created under planName (base directory) path NOT with planName/projectName
Two different report filename ‘coverage.xml’ and ‘coverage-report.xml’ have been referenced in two different commands(sonarScanner exe and sonarScanner batch). Disabled unwanted command of running Sonar scanner exe command