Hi @jacek.poreda, I think I have an update. I can reproduce the error without the GCP LoadBalancer hop.
I’ve deployed a pod on the same cluster as our Sonarqube Server, and ran a load test downloading a random plugin from the server using the internal K8s svc and the external HTTPS loadbalancer. I originally tried to use the commonly used apache benchmark (ab) tool, but our loadbalancer requires HTTP/1.1 and ab only supports HTTP/1.0. So the test uses h2load with the same configuration for both tests.
External LoadBalancer Load Test
$ h2load  -n 1000 -c 100 -T 10s https://sonarqube.[MASKED].com/api/plugins/download?plugin=cpp

starting benchmark...
spawning thread #0: 100 total client(s). 1000 total requests
TLS Protocol: TLSv1.3
Cipher: TLS_AES_128_GCM_SHA256
Server Temp Key: X25519 253 bits
Application protocol: h2
progress: 10% done
progress: 20% done
progress: 30% done
progress: 40% done
progress: 50% done
progress: 60% done
progress: 70% done
progress: 80% done
progress: 90% done
finished in 514.40s, 1.91 req/s, 102.50MB/s
requests: 1000 total, 994 started, 989 done, 980 succeeded, 20 failed, 20 errored, 4 timeout
status codes: 993 2xx, 0 3xx, 0 4xx, 0 5xx
traffic: 51.49GB (55285310234) total, 59.62KB (61047) headers (space savings 83.16%), 51.45GB (55238990142) data
                     min         max         mean         sd        +/- sd
time for request:   322.14ms      14.37s       7.28s       2.31s    72.65%
time for connect:    18.36ms     89.99ms     60.50ms     19.29ms    61.63%
time to 1st byte:   121.94ms       7.20s       2.98s       2.13s    70.93%
req/s           :       0.00        0.15        0.10        0.02    84.88%
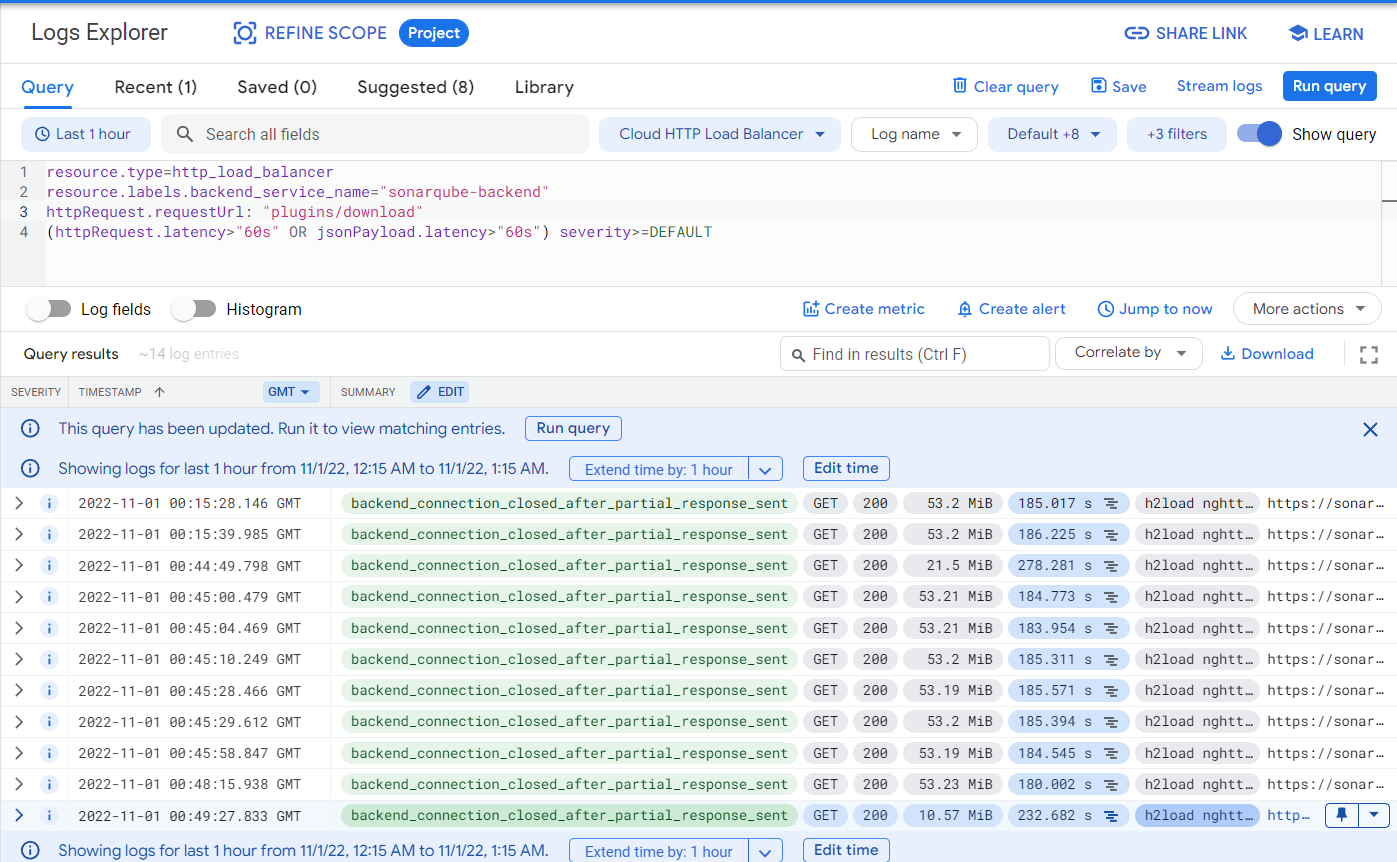
h2load doesn’t have the best client-side logging, but we can easily check our Google Cloud Logs, and see the same error which is plaguing our CI/CD systems. The requests are returning 200, it seems like all the data is transmitted, but the request never terminates and the loadbalancer logs summarizes the request as statusDetails: "backend_connection_closed_after_partial_response_sent"
Internal Load Test:
$ h2load -v -n 1000 -c 100 -T 10s http://sonarqube-sonarqube.default:9000/api/plugins/download?plugin=cpp
...
progress: 70% done
progress: 80% done
progress: 90% done
[stream_id=19] x-content-type-options: nosniff
[stream_id=19] cache-control: no-cache, no-store, must-revalidate
[stream_id=19] sonar-md5: 6b77cb35e18da7134308ed017e64adb2
[stream_id=19] content-type: application/java-archive
[stream_id=19] date: Tue, 01 Nov 2022 00:33:07 GMT
[stream_id=19] x-envoy-upstream-service-time: 91
[stream_id=19] server: envoy
[stream_id=19] :status: 200
[stream_id=19] x-frame-options: SAMEORIGIN
[stream_id=19] x-xss-protection: 1; mode=block
[stream_id=19] x-content-type-options: nosniff
[stream_id=19] cache-control: no-cache, no-store, must-revalidate
[stream_id=19] sonar-md5: 6b77cb35e18da7134308ed017e64adb2
[stream_id=19] content-type: application/java-archive
[stream_id=19] date: Tue, 01 Nov 2022 00:33:07 GMT
[stream_id=19] x-envoy-upstream-service-time: 81
[stream_id=19] server: envoy
The logs stop here, and never continue. This is reproducible with these load configurations, it always fails around the 90% mark. In the external test theLoadBalancer is configured with a 180 second timeout, which is why most requests stop there. But in the internal test, even after configuring h2load with a 10 second timeout (-T 10s), the test hangs indefinitely. According to the sonarqube tomcat metrics, sonarqube’s embedded web server has a timeout of 60,000ms aka 1 minute. However, even letting the test sit for nearly an hour does not complete.
I’ve configured sonarqube with the following Log options for debugging:
- name: SONAR_LOG_LEVEL_WEB
  value: DEBUG
- name: SONAR_LOG_LEVEL_APP
  value: DEBUG
- name: SONAR_WEB_ACCESSLOGS_ENABLE
  value: "true"
Going into the filesystem, I see the following log entries:
access.log
...
127.0.0.1 - - [01/Nov/2022:02:59:26 +0000] "GET /api/plugins/download?plugin=cpp HTTP/1.1" 200 - "-" "h2load nghttp2/1.47.0" "AYQxBwFk/o1eN4YOAAwG"
127.0.0.1 - - [01/Nov/2022:02:59:26 +0000] "GET /api/plugins/download?plugin=cpp HTTP/1.1" 200 - "-" "h2load nghttp2/1.47.0" "AYQxBwFk/o1eN4YOAAwL"
127.0.0.1 - - [01/Nov/2022:02:59:26 +0000] "GET /api/plugins/download?plugin=cpp HTTP/1.1" 200 - "-" "h2load nghttp2/1.47.0" "AYQxBwFk/o1eN4YOAAwM"
127.0.0.1 - - [01/Nov/2022:02:59:26 +0000] "GET /api/plugins/download?plugin=cpp HTTP/1.1" 200 - "-" "h2load nghttp2/1.47.0" "AYQxBwFk/o1eN4YOAAwP"
127.0.0.1 - - [01/Nov/2022:02:59:26 +0000] "GET /api/plugins/download?plugin=cpp HTTP/1.1" 200 - "-" "h2load nghttp2/1.47.0" "AYQxBwFk/o1eN4YOAAwQ"
127.0.0.1 - - [01/Nov/2022:02:59:26 +0000] "GET /api/plugins/download?plugin=cpp HTTP/1.1" 200 - "-" "h2load nghttp2/1.47.0" "AYQxBwFk/o1eN4YOAAwO"
127.0.0.1 - - [01/Nov/2022:02:59:26 +0000] "GET /api/plugins/download?plugin=cpp HTTP/1.1" 200 - "-" "h2load nghttp2/1.47.0" "AYQxBwFk/o1eN4YOAAwN"
This is the end of the file, with no new entries, as the test sits hanging. No indication of any issue. In fact, I can’t find any issue in any of log files. I have all the files saved, please let me know what steps you would like to see me try.